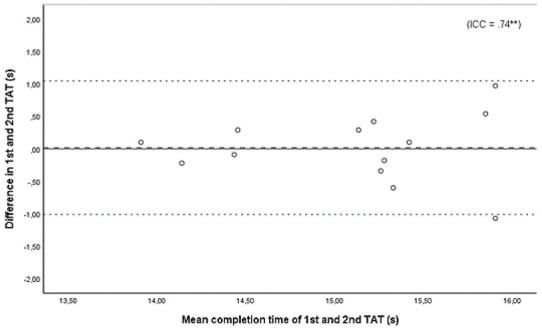
Figure 2.

Bland-Altman plot for test-retest reliability of the TAT (n=13). The dashed line represents the mean difference in completion time of the first and second test day. The dotted lines represent the 95% Limits of Agreement (M ± 1.96 SD). The ICC is included in the figure; **p < .01
