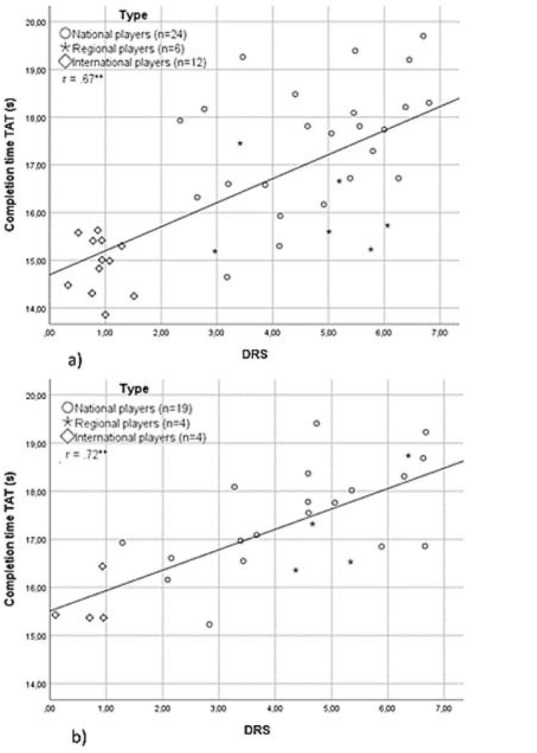
Figure 4.

Pearson correlations of the DRS and completion time on the TAT with r = .67 (n = 42; **p < .01) for the boys (4a) and r = .72 (n = 29; **p < .01) for the girls (4b). The different participant groups (i.e., international, national, and regional) and correlations are assigned in the figure.
