Figure 3.

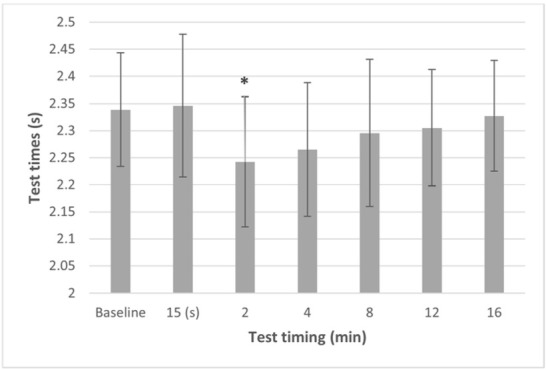
Mean ± SD of deceleration test times of the Plyometric condition (P). * Significant difference from baseline (p ≤ 0.05). Note: lower values mean improvement of performance compared to baseline measurement.

Mean ± SD of deceleration test times of the Plyometric condition (P). * Significant difference from baseline (p ≤ 0.05). Note: lower values mean improvement of performance compared to baseline measurement.