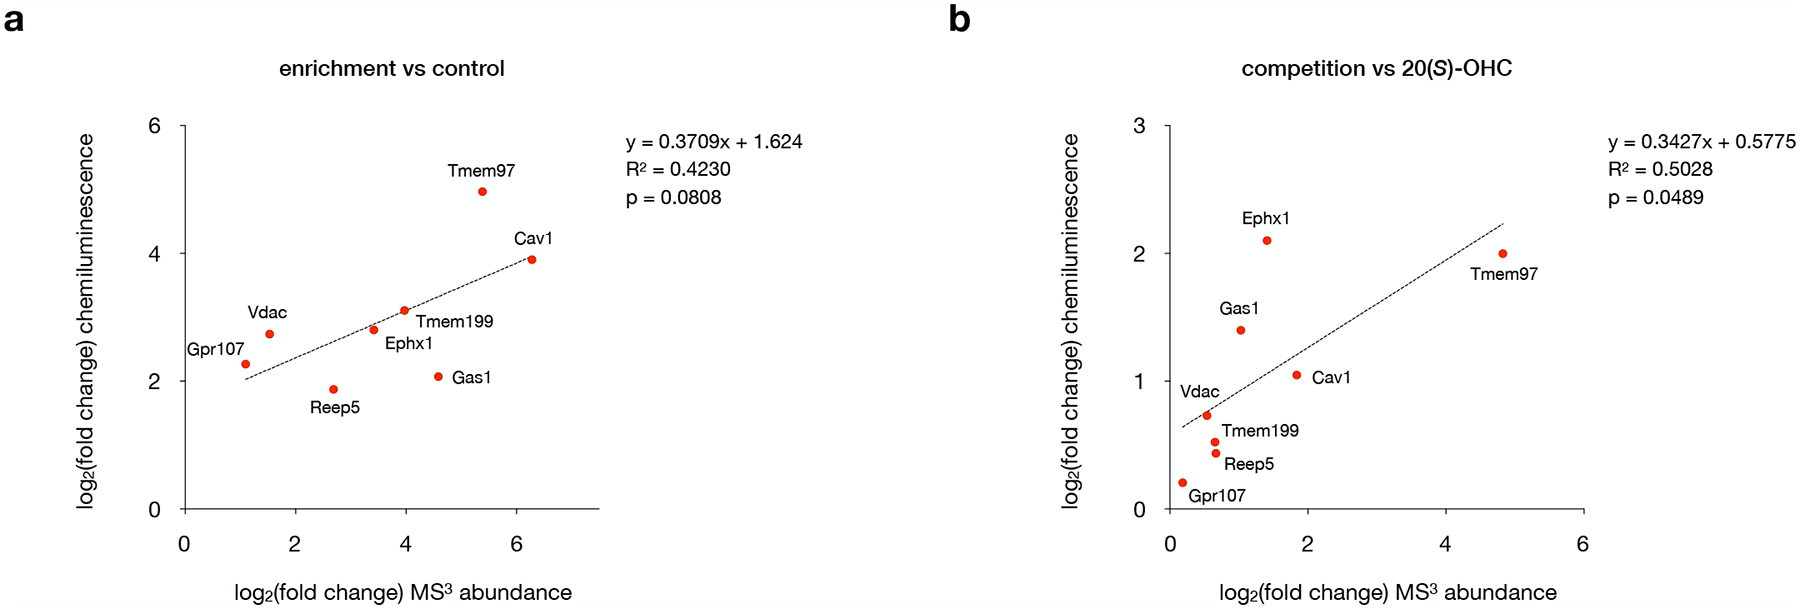
Extended Data Fig. 4: Comparison of Western blot and mass spectrometry quantification.

a, Log2(fold change) values for target protein enrichment obtained from mass spectrometry analysis versus quantitative Western blot. Statistical significance, assessed by linear regression in GraphPad Prism, is shown (R2 = 0.4230, p = 0.0808).
b, Log2(fold change) values for 20(S)-OHC competition obtained from mass spectrometry analysis versus quantitative Western blot. Statistical significance, assessed by linear regression in GraphPad Prism, is shown (R2 = 0.5028, p = 0.0489).
For a and b, data points represent quantification of one set of Western blots, where two independent experiments were performed with similar results, plotted against average mass spectrometry values from four biological replicates.
