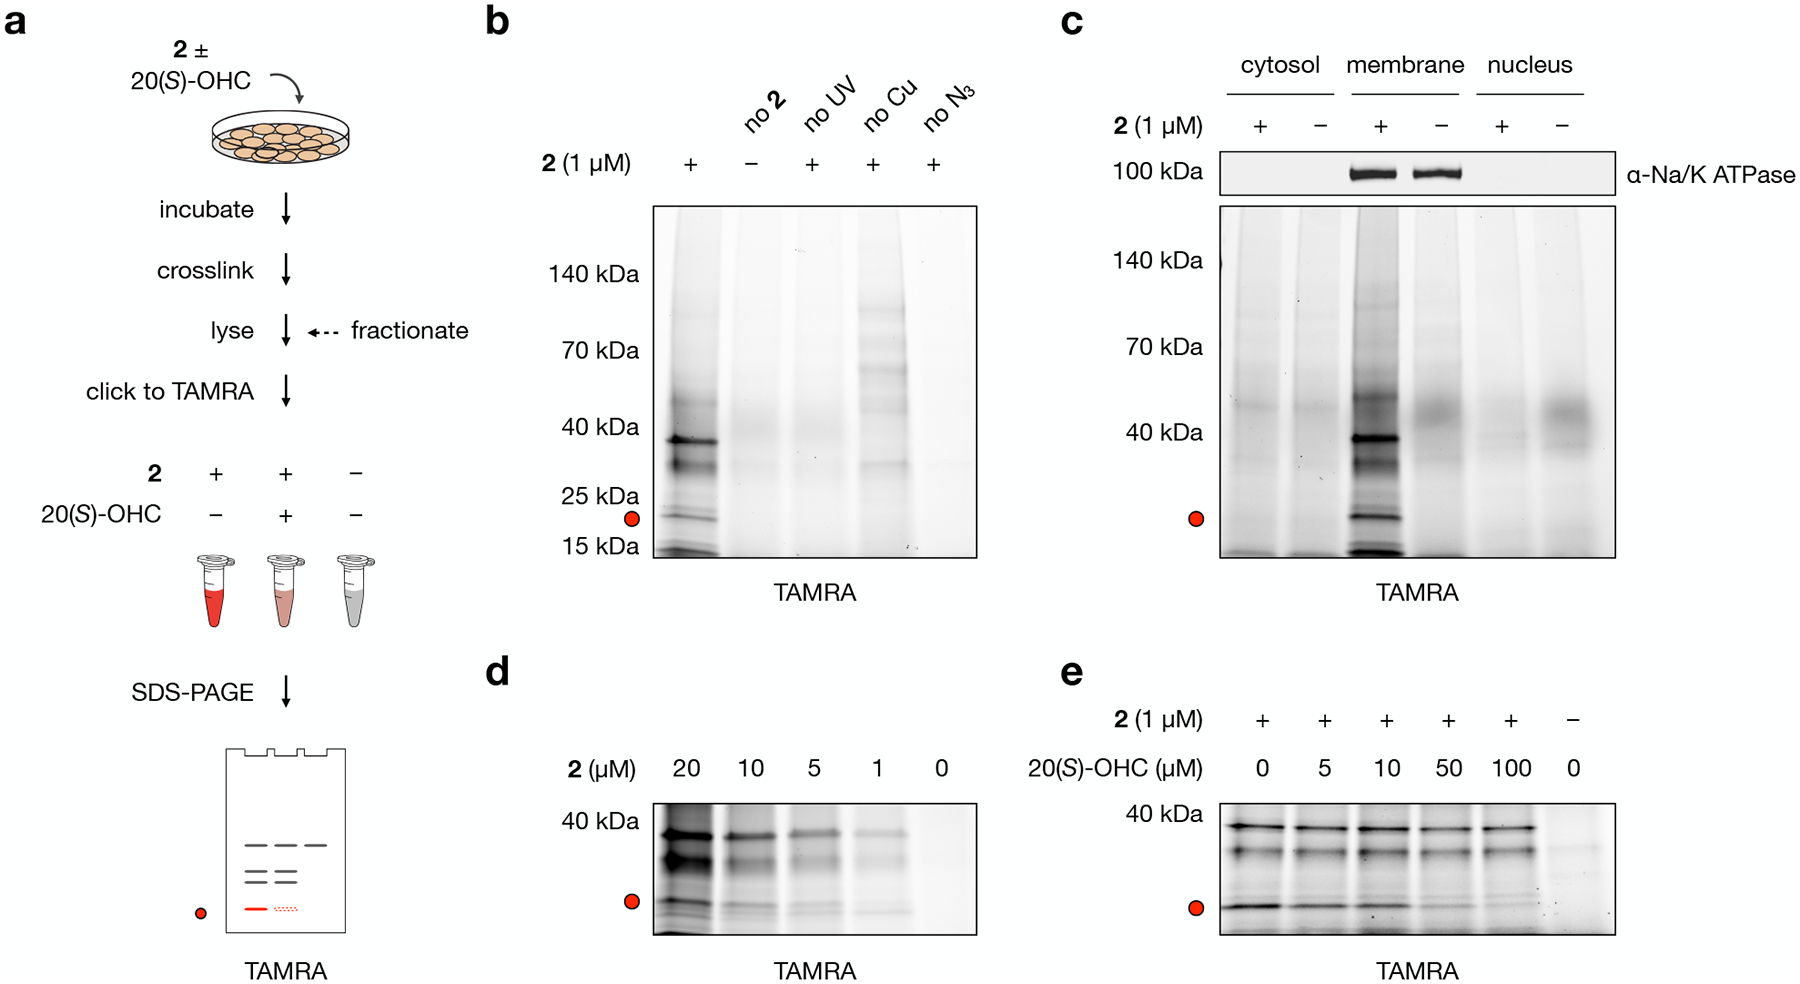
Fig. 2: Probe 2 labels membrane proteins in live NIH-3T3 cells.

a, Workflow for gel-based profiling of probe 2 target proteins. Cells are incubated for 30 min with 1 μM 2, DMSO, or 1 μM 2 + 50 μM 20(S)-OHC and irradiated for 5 min with 368 nm light. Isolated membrane fractions are subjected to a click reaction with TAMRA azide, separated by SDS-PAGE, and visualized by in-gel fluorescence.
b, Control experiments demonstrate that fluorescent labeling requires treatment with 2, exposure to UV light, and click ligation to TAMRA. In the “no 2” condition, cells were incubated with DMSO only; in the “no UV” condition, probe-treated cells were not exposed to 368 nm light; in the “no Cu” condition, CuSO4 was omitted from the click catalyst mixture; in the “no N3” condition, TAMRA azide was omitted from the click reaction.
c, Cell fractionation shows that TAMRA-labeled proteins appear primarily in the membrane fraction as opposed to cytosolic or nuclear fractions. The sodium/potassium-transporting ATPase subunit alpha-1 (Na/K ATPase) was used as a membrane marker.
d, Proteins in the membrane fraction are labeled by 2 in a dose-dependent manner.
e, Competition by 20(S)-OHC during incubation of cells with 2 reduces TAMRA labeling of a 21 kDa band in a dose-dependent manner.
The red dot at 21 kDa in panels a–e marks the location of a competable TAMRA-labeled band. Experiments in b, c, d, and e were repeated two times independently with similar results.
