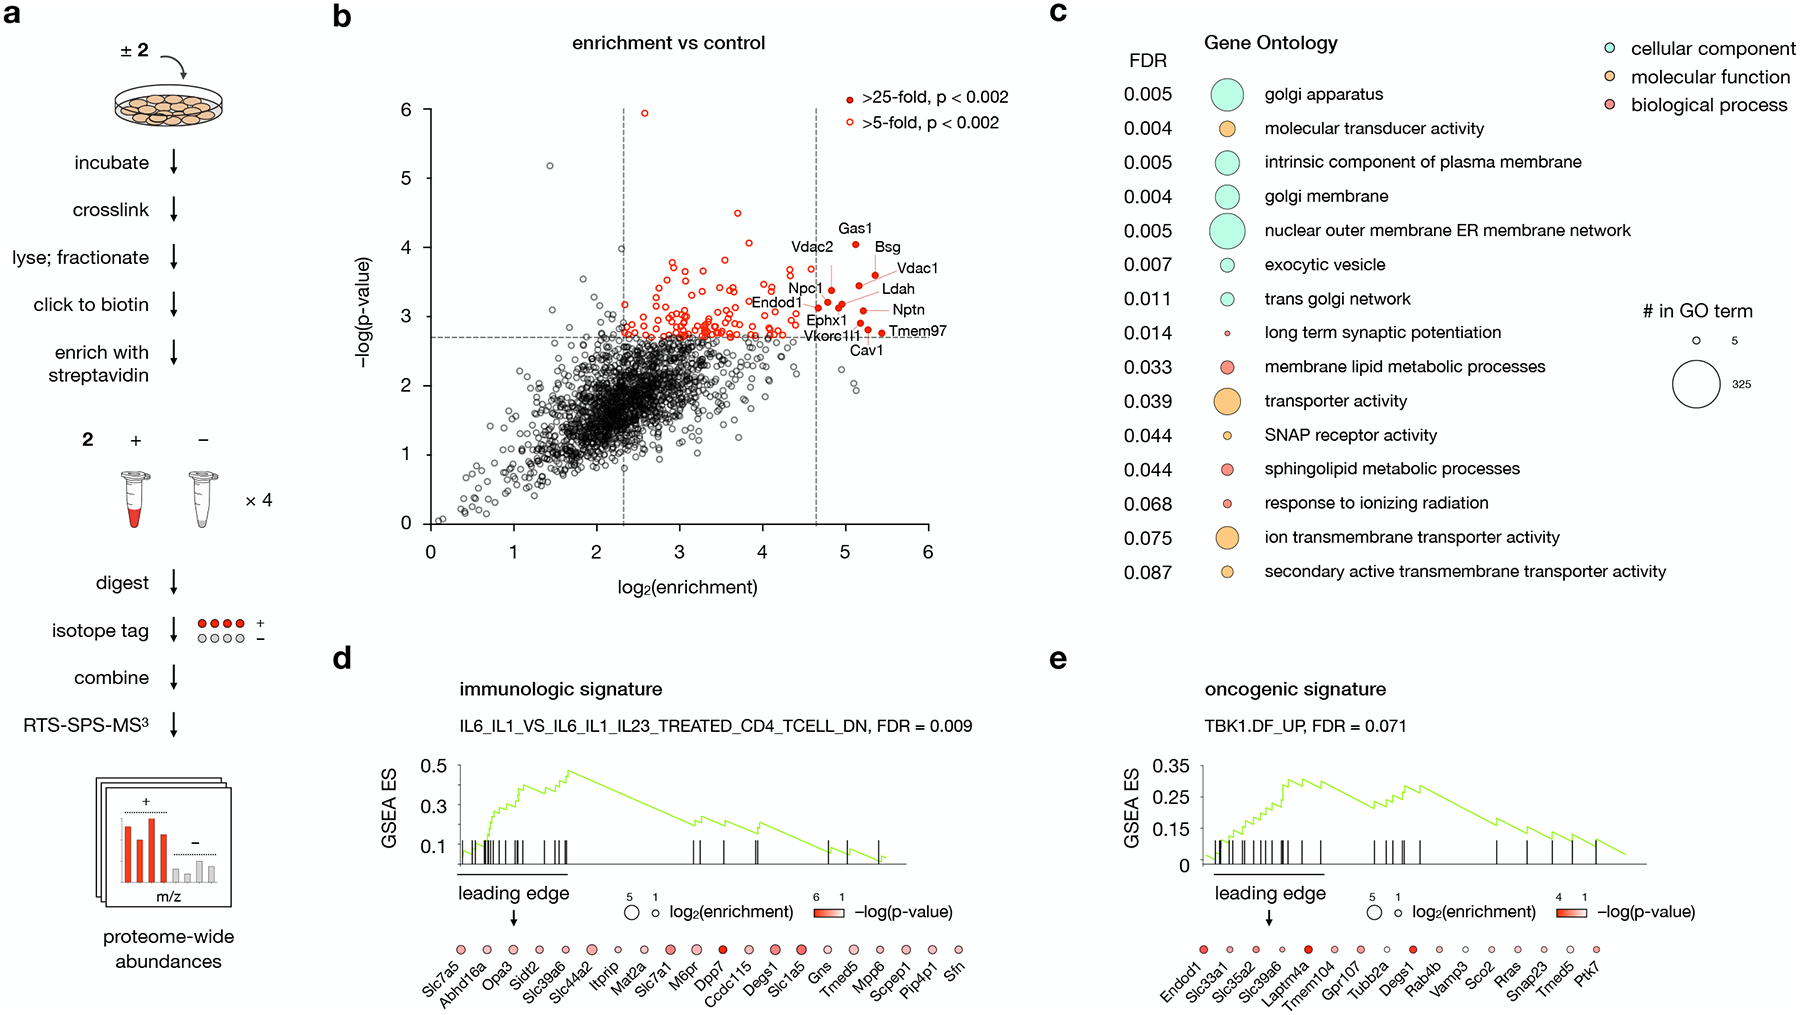
Fig. 3: Protein targets of probe 2 converge in distinct gene ontologies and disease signatures.

a, Workflow for MS-based profiling of probe 2 target proteins. Cells are incubated for 30 min with 1 μM 2 or DMSO and irradiated for 5 min with 368 nm light. Isolated membrane fractions are subjected to a click reaction with biotin picolyl azide, enriched with streptavidin agarose, and digested with trypsin. Digested peptides from each sample are labeled with unique isobaric mass tags, then samples are pooled and analyzed by LC/RTS-SPS-MS3.
b, Volcano plot showing statistical significance versus average log2(fold change) (“log2(enrichment)”) of peptides isolated from cells treated with 2 or DMSO alone. Cutoffs discussed in the text at a p-value of 0.002 and fold changes of 25 and 10 are indicated. Data represent 4 biological replicates consisting of matched experiments with 2 and DMSO. Statistical significance for each protein was calculated using a two-tailed paired t-test.
c, Gene Set Enrichment Analysis (GSEA) of 2-enriched proteins using the Gene Ontology (GO) gene set. The top 16 GO pathways ranked by NES (Normalized Enriched Score) are listed. Bubbles are colored according to GO term class; bubble size is proportional to the number of 2-enriched proteins found in each gene set.
d,e, GSEA using d, the immunologic and e, the oncogenic signature gene sets for 2-enriched proteins. Enriched proteins the leading edge of the gene set are listed; color and size of the bubbles represent log2(enrichment) and −log(p-value), respectively. For additional gene sets associated with 2-enriched proteins, see Supplementary Table 1.
For c, d, and e, statistical significance was assessed using the GSEA software.
