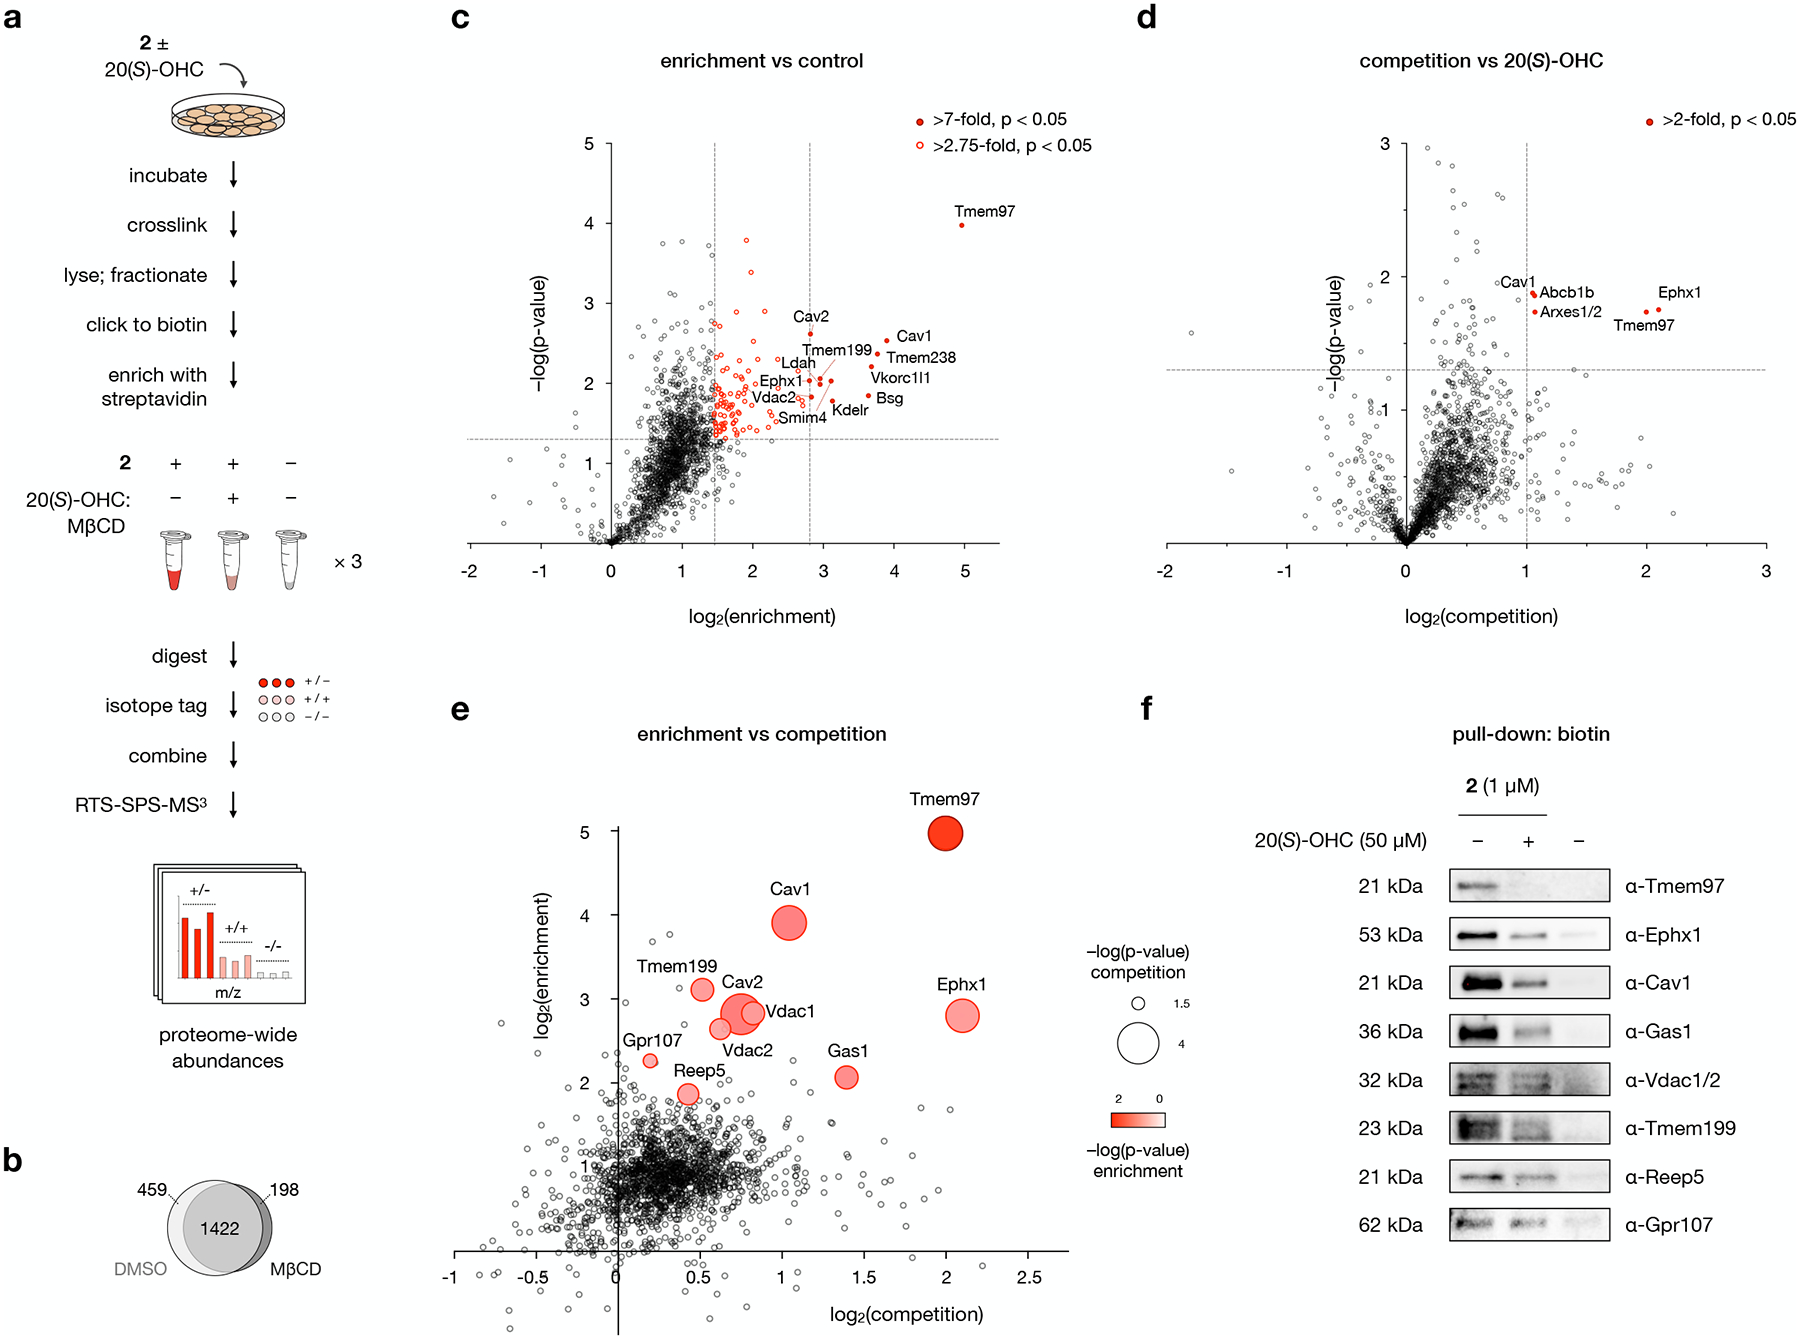
Fig. 4: 20(S)-OHC identifies enriched and competable probe 2 target proteins.

a, Workflow for MS-based profiling of probe 2 target proteins. Cells are pre-incubated with 50 μM 20(S)-OHC complexed with MβCD or with MβCD alone for 1 h before addition of 1 μM 2 or DMSO and further incubation for 30 min. Cells are irradiated for 5 min with 368 nm light, then isolated membrane fractions are subjected to a click reaction with biotin picolyl azide, enriched with streptavidin agarose, and digested with trypsin. Digested peptides from each sample are labeled with unique isobaric mass tags, then samples are pooled and analyzed by LC/RTS-SPS-MS3.
b, Venn diagram of proteins enriched by probe 2 in the presence and absence of MβCD. See also Extended Data Fig. 3.
c, Volcano plot showing statistical significance versus average log2(fold change) (“log2(enrichment)”) of peptides isolated from cells treated with 1 μM 2 or DMSO alone. Cutoffs discussed in the text at a p-value of 0.05 and fold changes of 7 and 2.75 are indicated.
d, Volcano plot showing statistical significance versus average log2(fold change) (“log2(competition)”) of peptides isolated from cells treated with 2 or 2 + 20(S)-OHC. Cutoffs discussed in the text at a p-value of 0.05 and a fold change of 2 are indicated.
e, Scatter plot of enrichment versus competition for 2 target proteins. Proteins selected for Western blot analysis are shown as bubbles, where size and color represent p-values for competition and enrichment, respectively.
For c, d, and e, data represent 3 biological replicates of matched experiments with 2, 2 + 20(S)-OHC, and DMSO. For c and d, statistical significance for each protein was calculated using a two-tailed paired t-test.
f, Western blot analysis of proteins labeled by 2 in the presence of 20(S)-OHC or DMSO, clicked to biotin, enriched on streptavidin, and resolved by SDS-PAGE. For quantitative analysis, see Extended Data Fig. 4.
