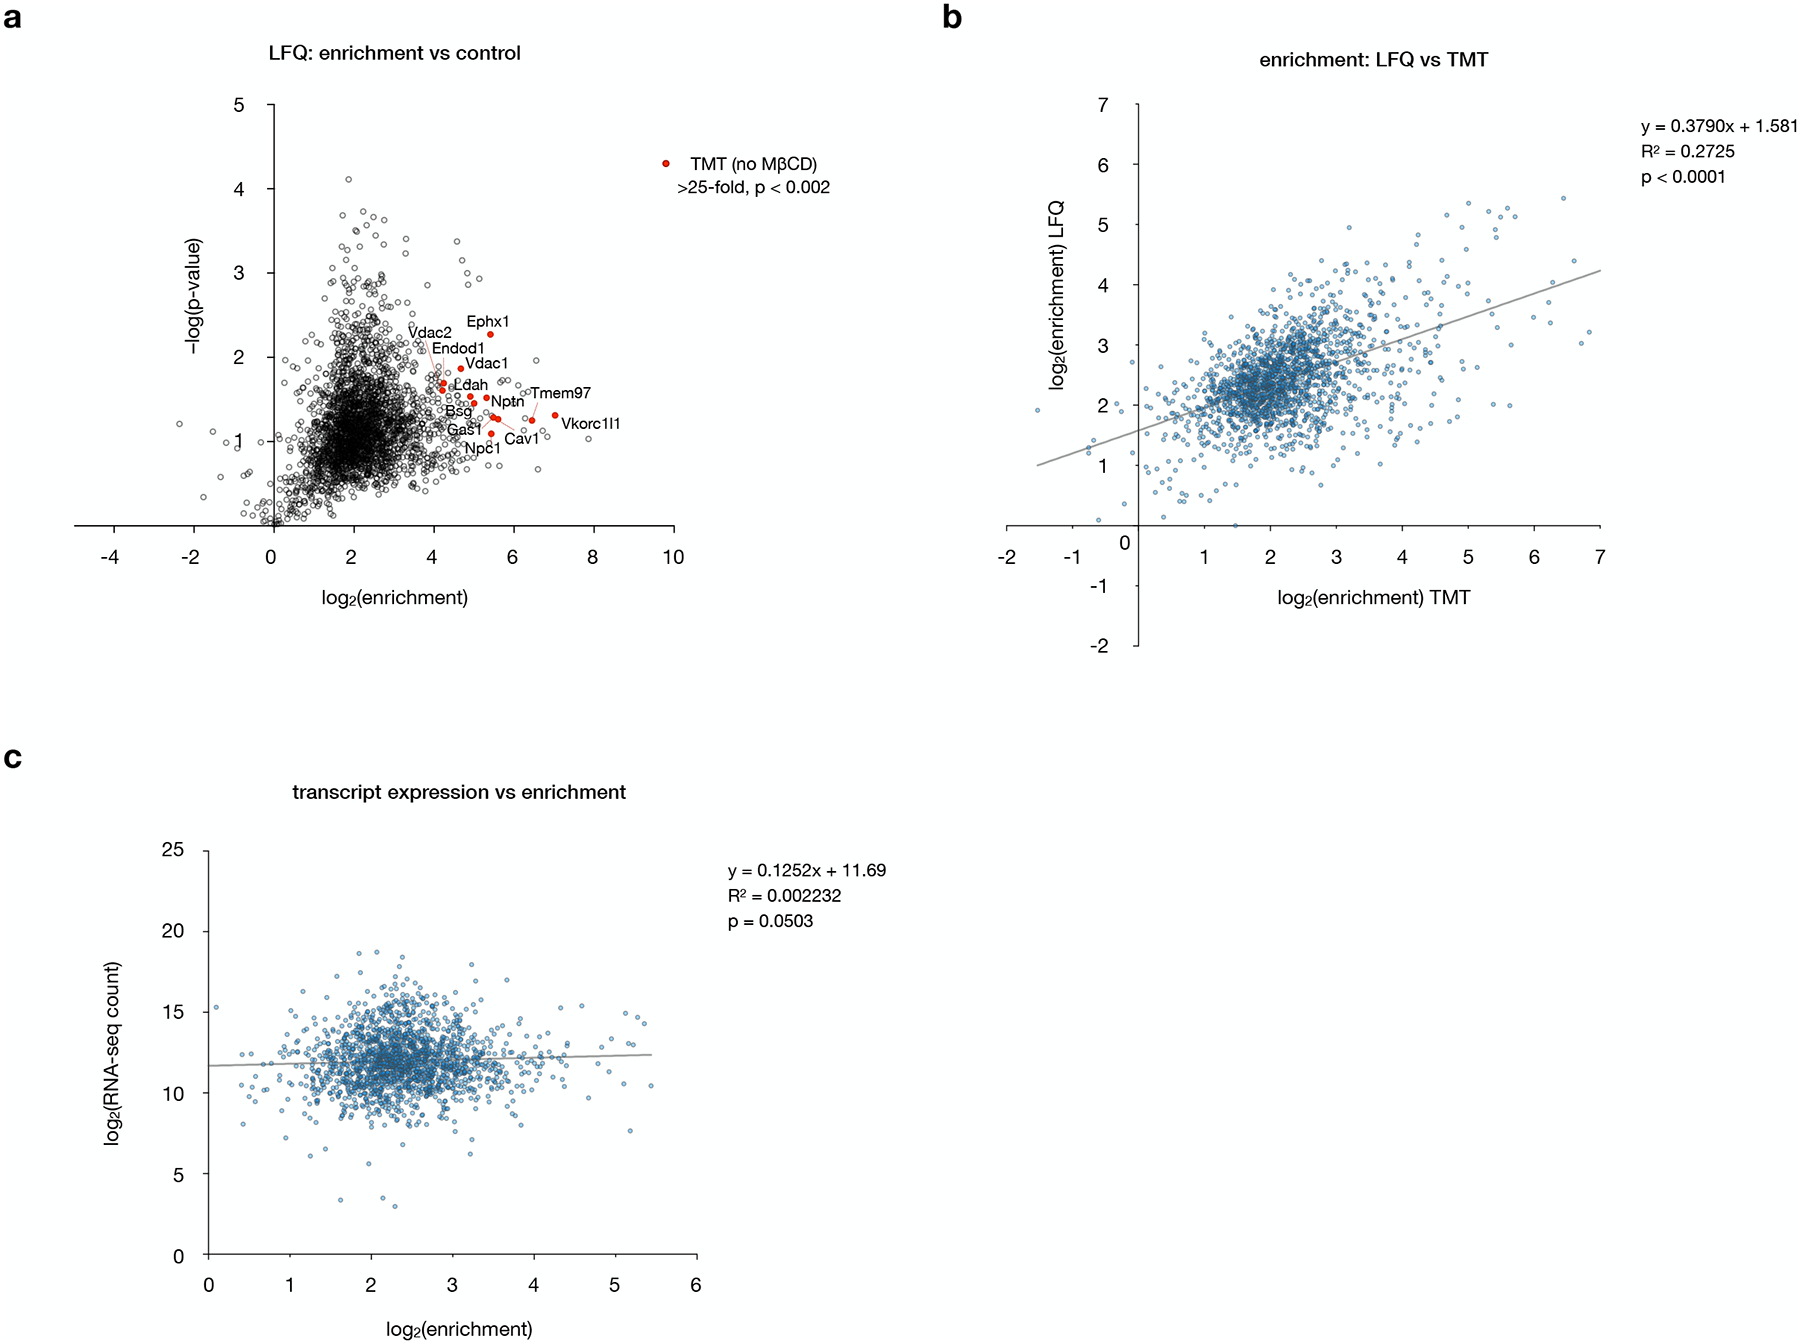
Extended Data Fig. 2: The enrichment profile of 2 is independent of quantification method and mRNA transcript abundance.

a, Volcano plot of proteins enriched by 2 versus DMSO alone, performed as in Fig. 3a but quantified by label-free quantification (LF Q) instead of TMT analysis. The top 12 enriched proteins identified by TMT analysis (labeled in Fig. 3b) are highlighted in red. Data represent two biological replicates consisting of matched experiments with 2 and DMSO. Statistical significance for each protein was calculated using a two-tailed paired t-test.
b, Plot of enrichment values from label-free versus TMT quantification, showing a positive correlation. Statistical significance, assessed by linear regression in GraphPad Prism, is shown (R2 = 0.2725, p < 0.0001).
c, Plot of RNA transcript abundances in NIH-3T3 cells (ref 16) versus enrichment of the corresponding proteins by TMT quantification, showing no significant correlation. Statistical significance, assessed by linear regression in GraphPad Prism, is shown (R2 = 0.002232, p = 0.0503).
