
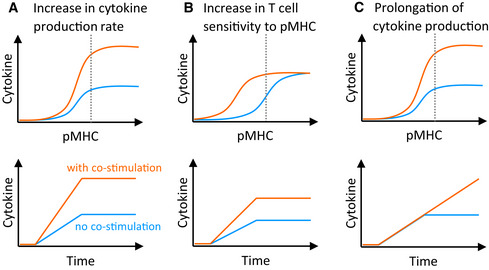
Figure 1. Quantitative effects of co‐stimulation on the T‐cell cytokine response.
-
A–CGraphical representation of hypothetical co‐stimulation affecting the (A) rate, (B) sensitivity and (C) duration of the T‐cell cytokine response, shown as pMHC dose response at the endpoint (top row) and time courses at the pMHC dose indicated by the dotted line (bottom row). The y‐axis represents the cumulative amount of cytokine produced. Blue and orange lines represent the cytokine response in the absence and presence of co‐stimulation, respectively.