FIGURE 3.
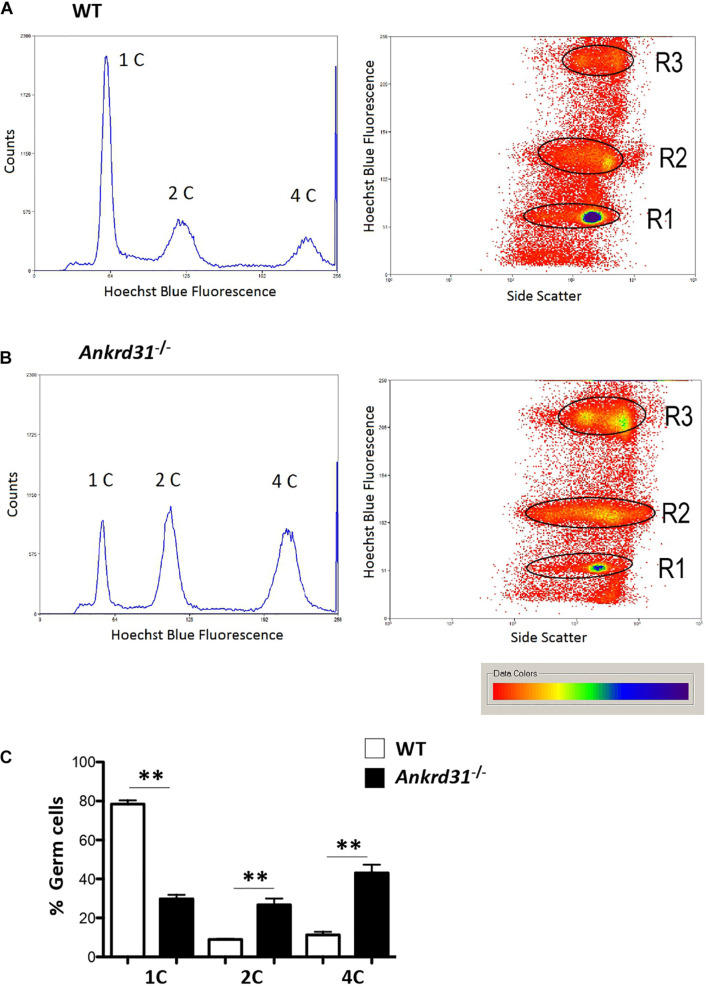
Representative histograms and density plot showing the distribution of testicular germ cell populations, based on their DNA content, in WT and Ankrd31–/– by flow cytometry. (A) FACS analysis of isolated WT male germ cells. (B) FACS analysis of isolated Ankrd31–/– male germ cells. (C) Quantification analysis between WT and Ankrd31–/– germ cell subpopulations isolated from n = 6 animals/each genotype. Data are expressed as percentage (%) of germ cells and reported as mean ± SEM, **p < 0.01.

