FIGURE 4.
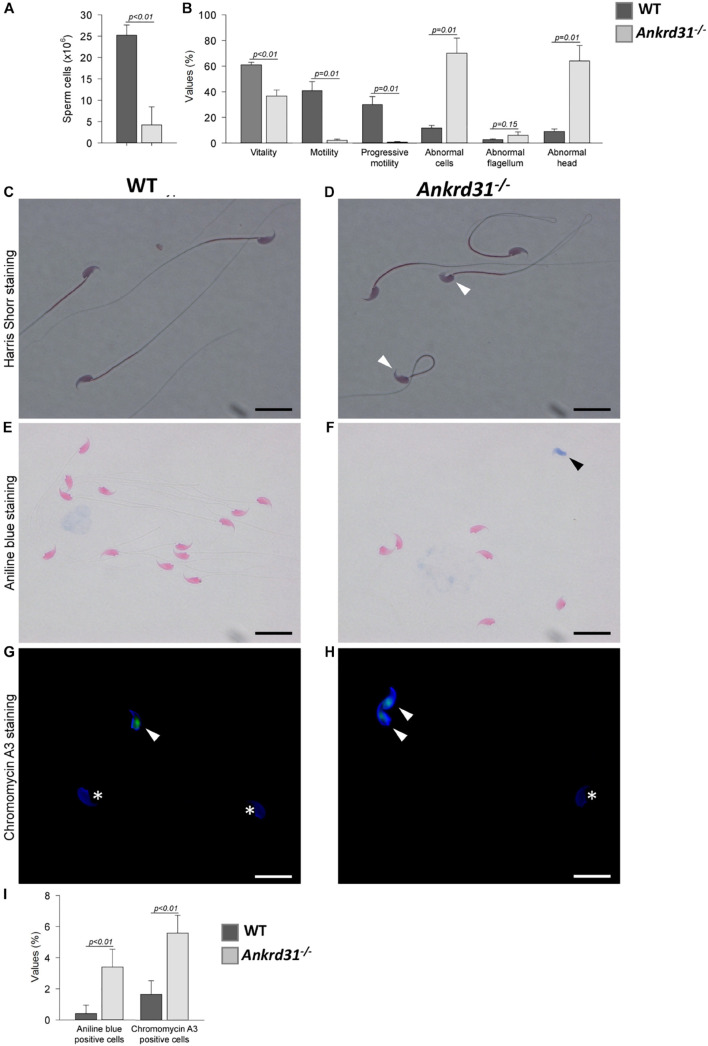
Sperm phenotyping of WT and Ankrd31–/– mice (n = 5 animals/each genotype). (A) Total sperm count (both epididymides) and (B) percentage values of standard parameters of WT and Ankrd31–/– mice. All percentage values were reported as mean ± SEM and compared based on student t-test with a probability value of less than 0.05 considered statistically significant (p < 0.05). (C,D) Harris-Shorr staining of WT and Ankrd31–/– spermatozoa (SPZ). Abnormal heads are indicated by white arrowheads. (E,F) Analysis of aniline blue staining of SPZ from WT and Ankrd31–/– mice. Positive staining was indicated by black arrowheads. (G,H) CMA3 staining of SPZ from WT and Ankrd31–/– mice. Positive staining was indicated by white arrowheads and negative staining by white asterisks. (I) Aniline blue and CMA3 percentage values are reported as mean ± SEM and compared based on student t-test with a probability value of less than 0.05 considered statistically significant (p < 0.05). (C–H) Scale bar corresponds to 10 μm.

