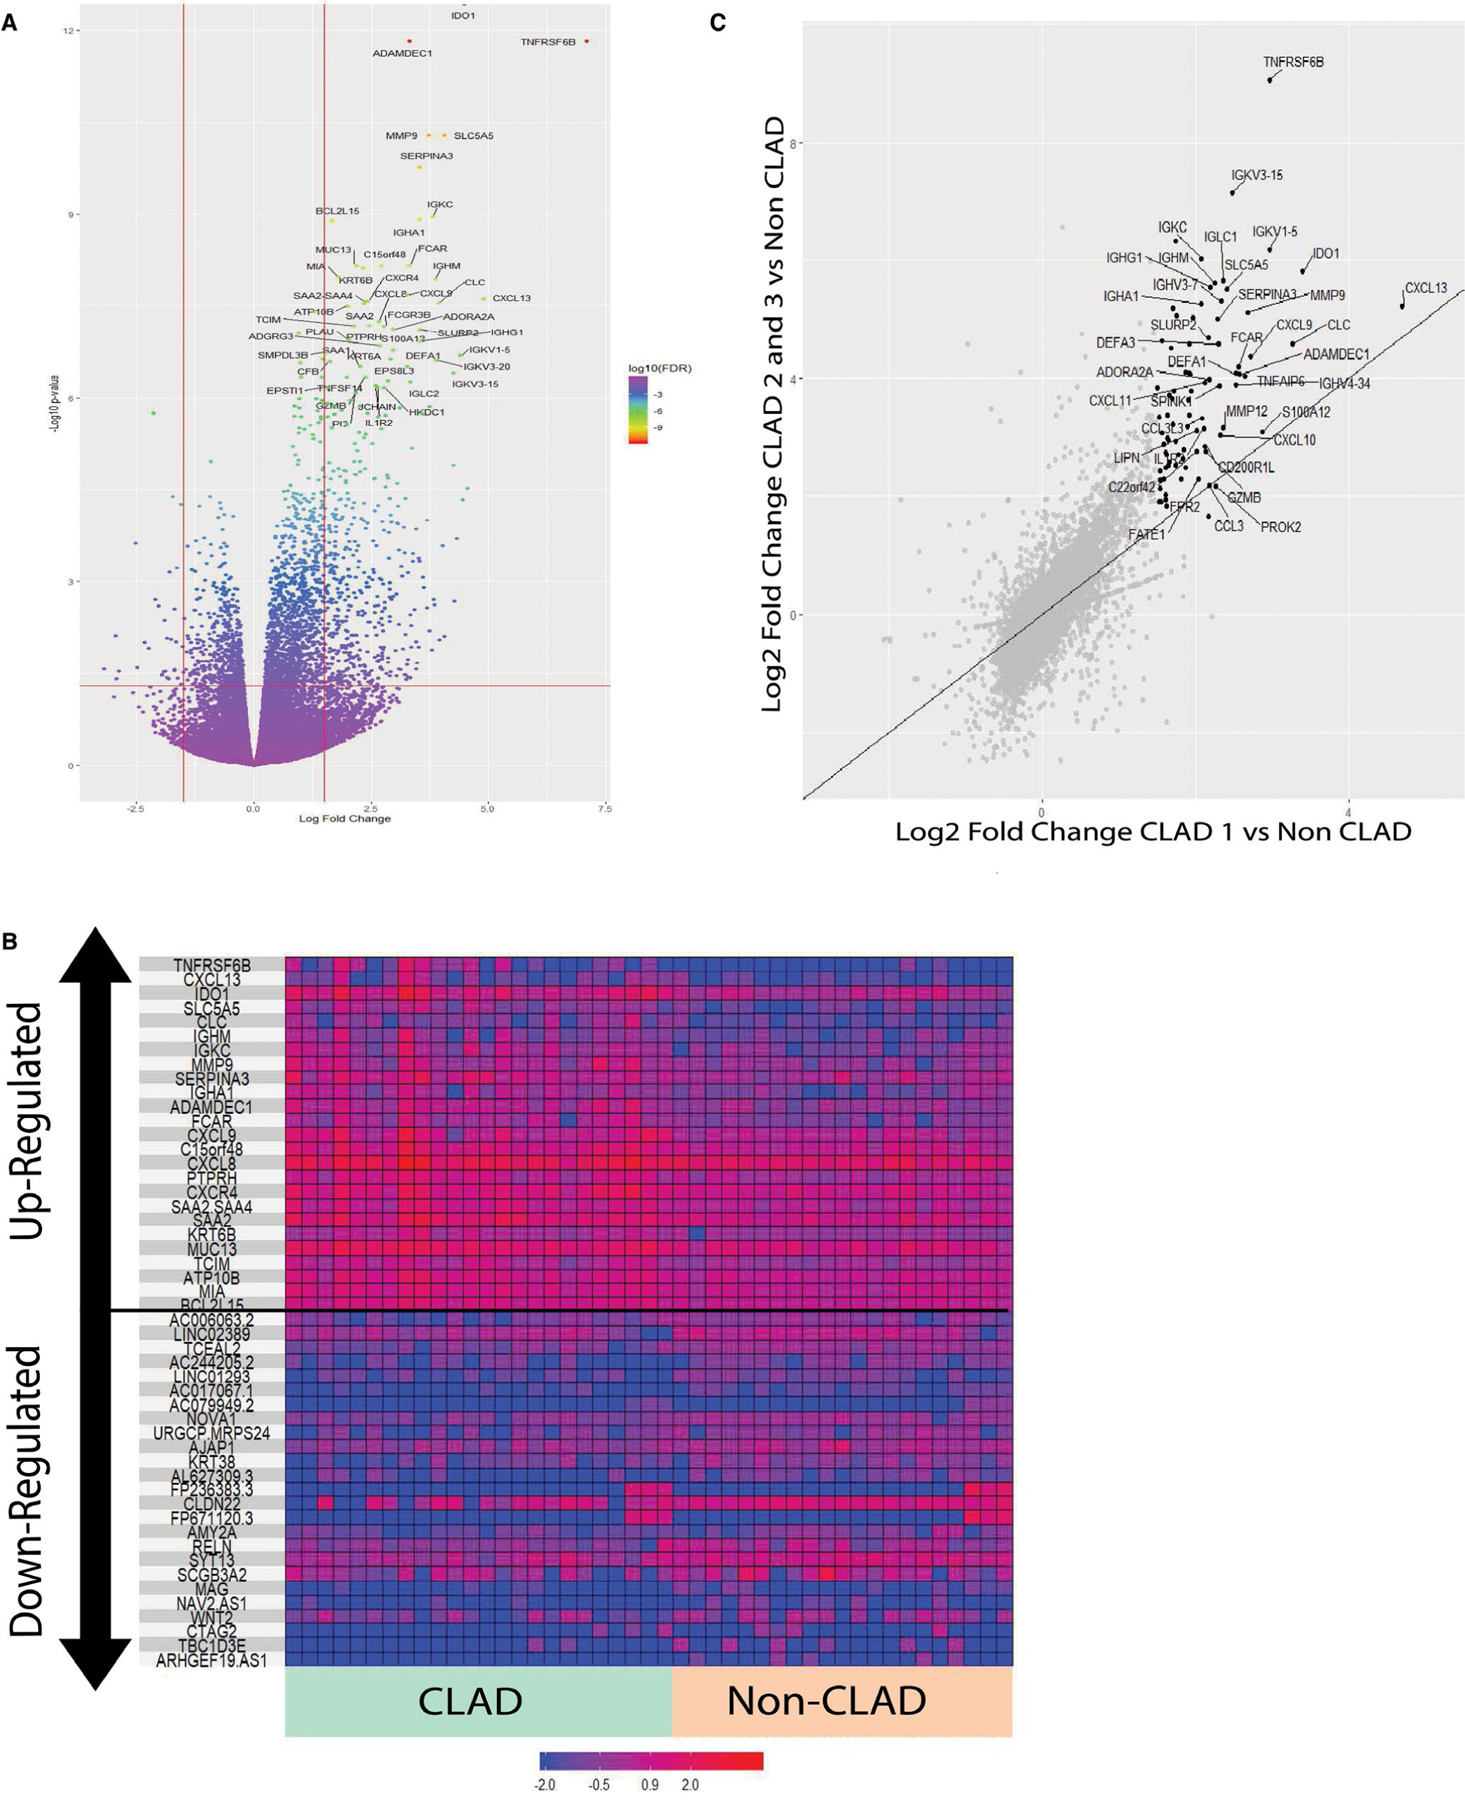
FIGURE 2.

(A) Volcano plot of DGE analysis for CLAD versus non-CLAD LTRs. Genes meeting the threshold for inclusion are indicated in the top left and top right sections divided by the red lines. Top upregulated genes are labeled. Top upregulated genes are shown and labeled in black. (B) Heat map showing the top 25 upregulated and top 25 downregulated genes in the CLAD versus non-CLAD DGE analysis. (C) Scatter plot showing the Log2 fold change for gene expression in the CLAD stage 1 versus Non-CLAD comparison (x-axis) versus that of the CLAD stage 2 and 3 versus Non-CLAD comparison
