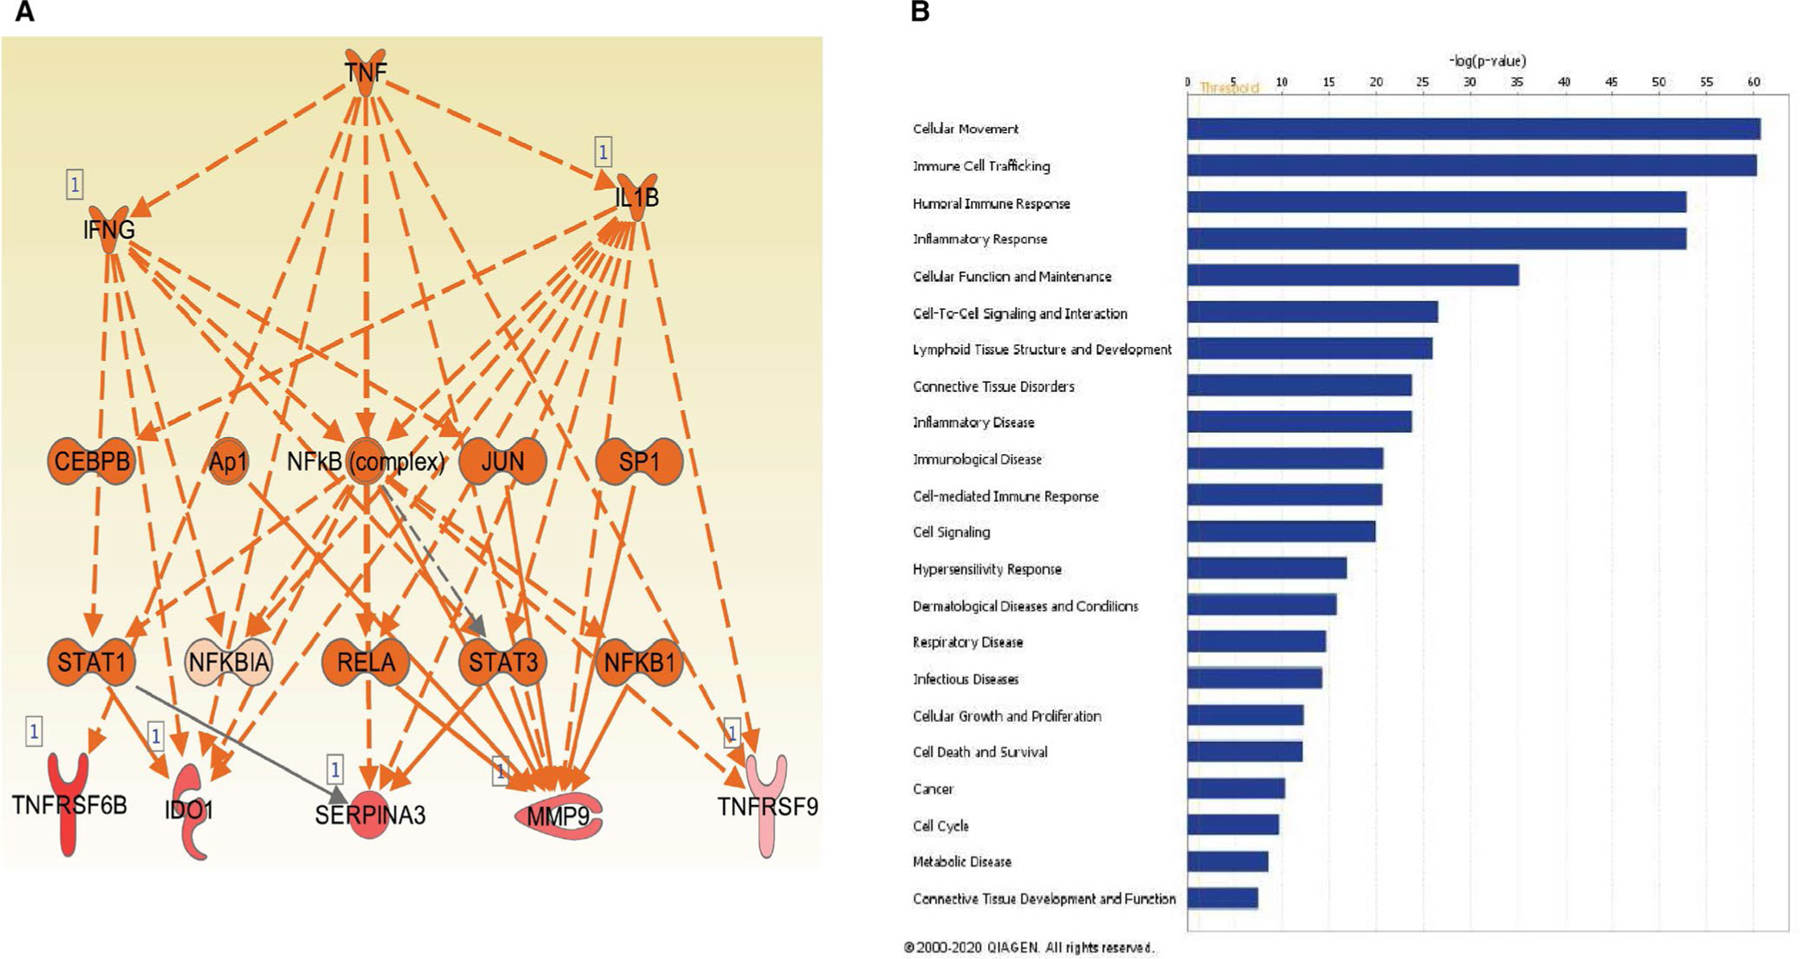
FIGURE 4.

(A) Sample network showing predicted activation using Ingenuity Pathway Analysis. The network shows the relationships between the three most activated upstream pathways: IFN-γ, TNF-α, and IL-1β and IDO1 and TNFRSF6B as downstream. (B) Gene enrichment analysis of selected disease and function groups of the upregulated genes. Multiple inflammatory and immune activation function groups were among the top predicted areas of activation
