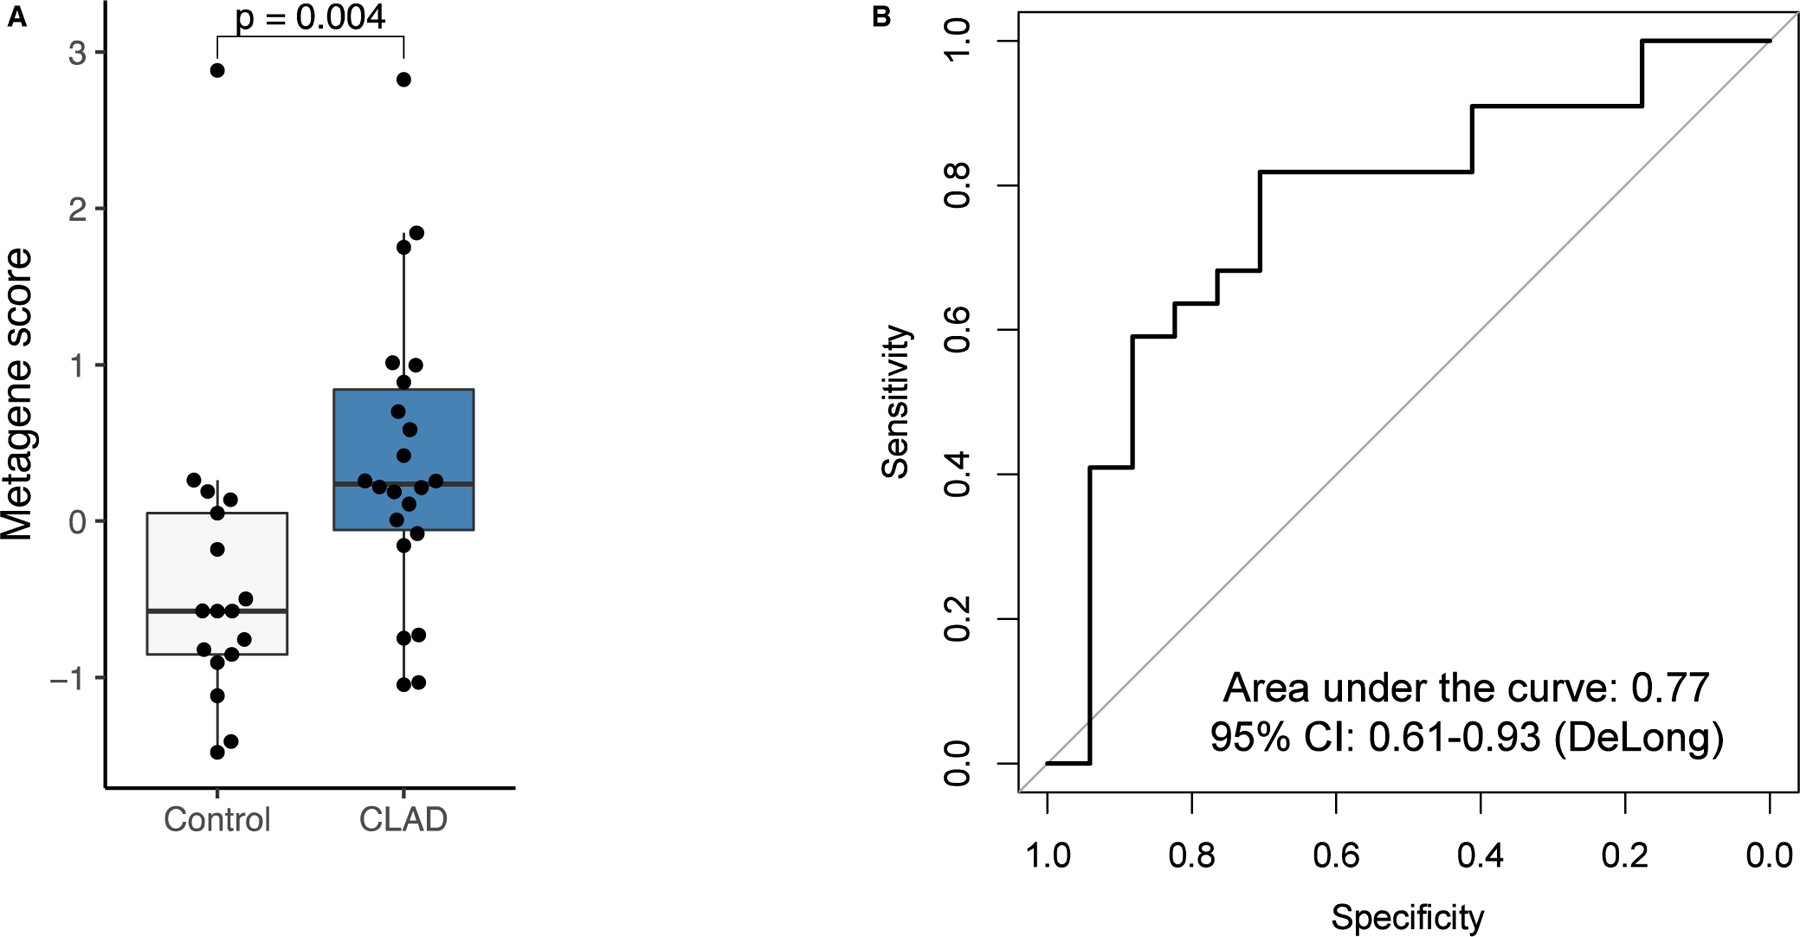
FIGURE 5.

(A) Comparison of top 25 activated genes identified in the experimental cohort in the CLAD and non-CLAD control patients in the external validation set. The top 25 genes were significantly upregulated in the CLAD patients of the validation set (P = .004). (B) ROC curve applying the top 25 activated genes identified in the experimental cohort to the validation cohort. The AUC =0.77 indicating a good ability to distinguish CLAD from non-CLAD
