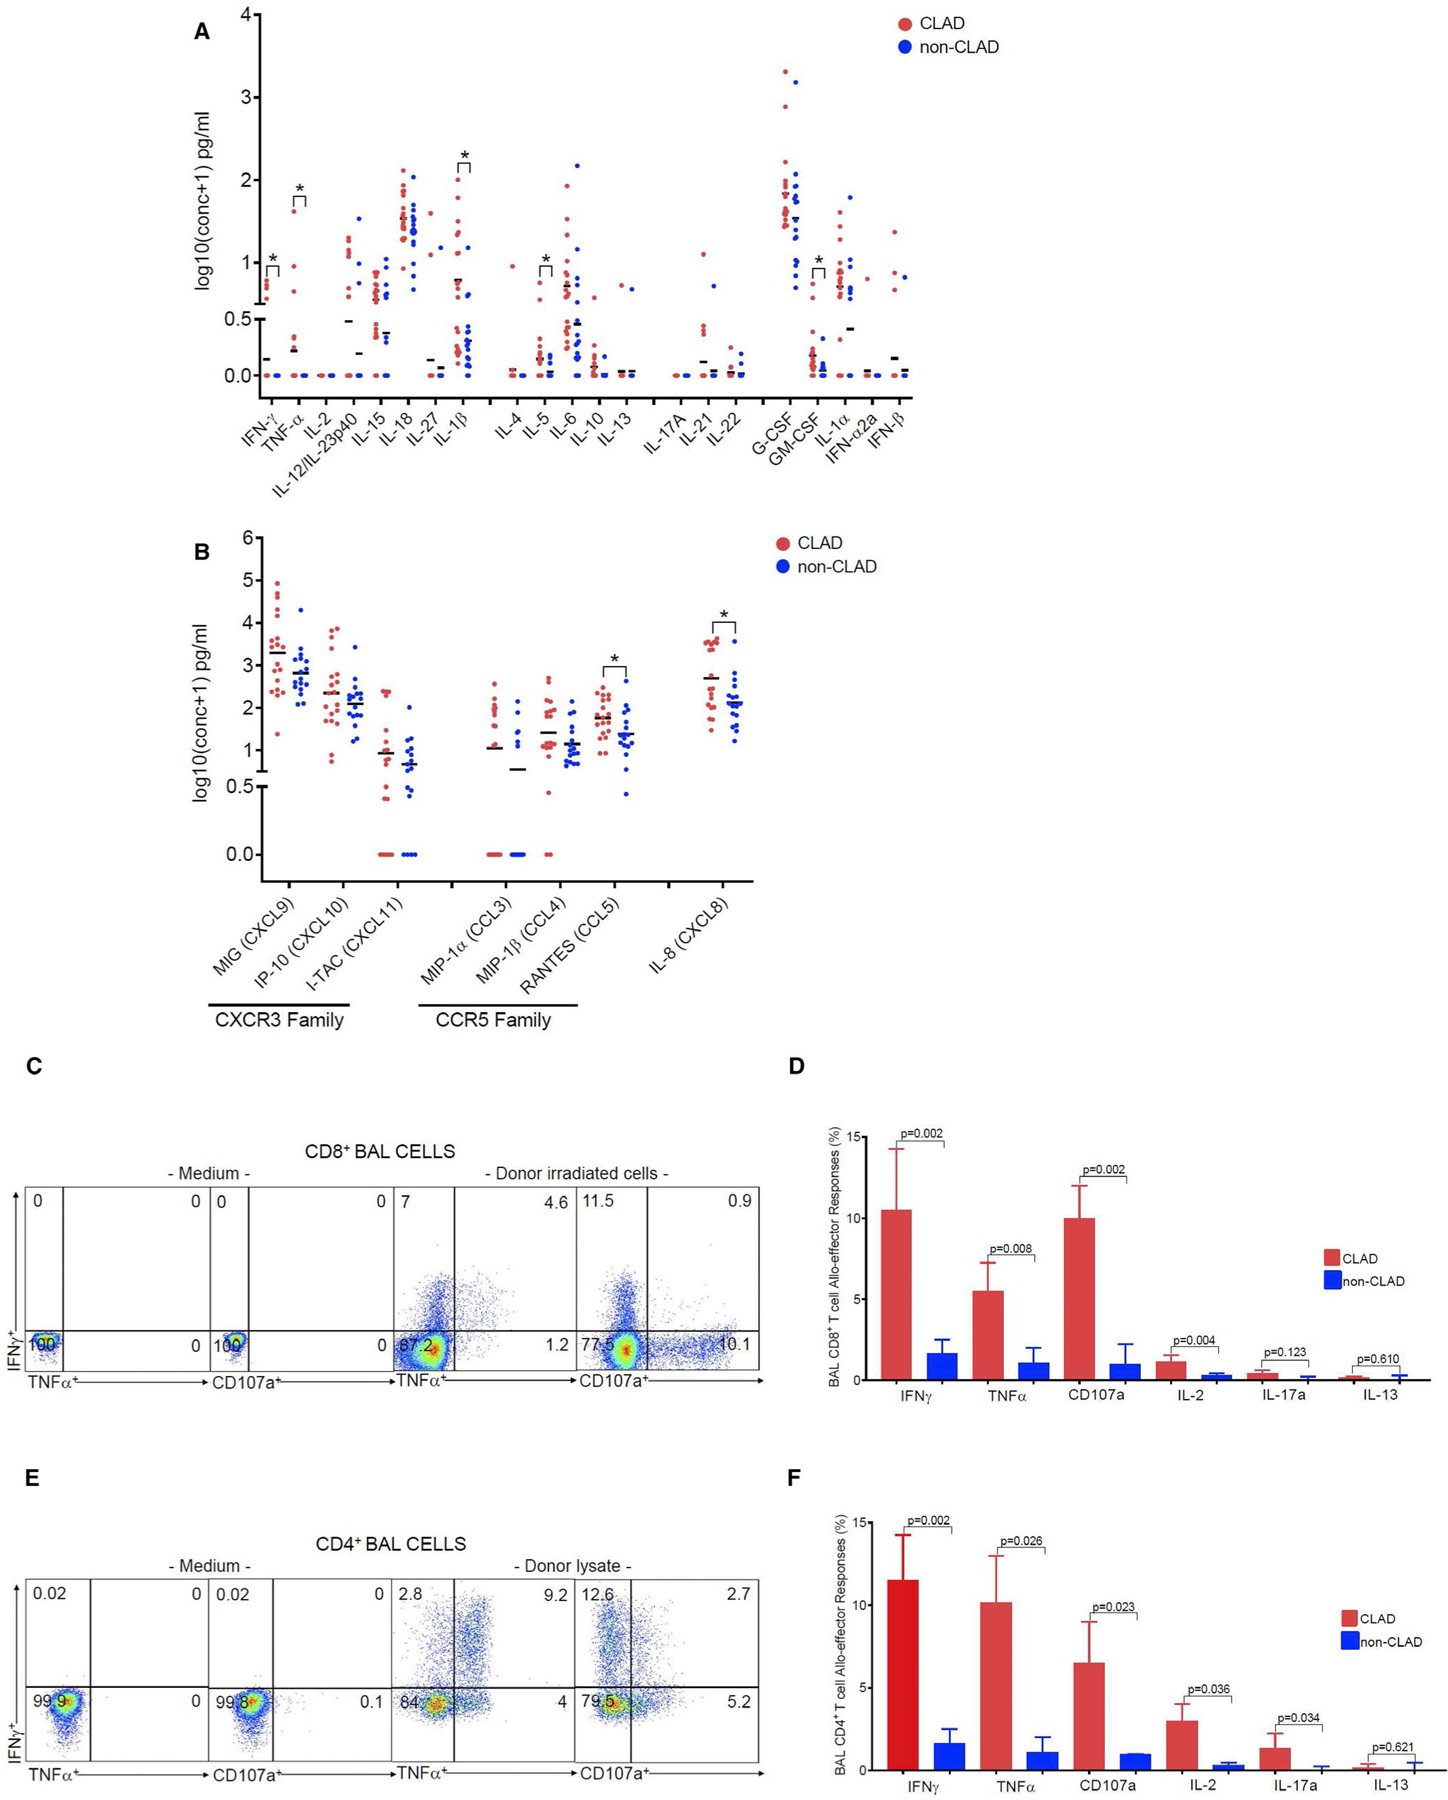
FIGURE 6.

Using MSD-meso scale discovery assay system-U-PLEX Technology-multiplex immunoassay we show the poled data from a total of 36 LTRs with a subset of 19 CLAD and 17 non-CLAD from BAL cells supernatants for cytokines (A) and chemokines (B). (A) We analyzed multiplex assay for following cytokines: such as: IFNγ, TNFα, IL-2, IL-12/IL-23p40, IL-15, IL-18, IL-27, IL-1β (Type 1), IL-4, Il-5. IL-6. IL-10, IL-13 (Type 2), and IL-17A, IL-21, IL-22 (Type 17), and G-CSF, GM-CSF, IL1α, IFN-α2a, IFNβ. (B) We analyzed multiplex assay for following chemokines such as: CXCR3 family (MIG, IP-10, I-TAC) and CCR5 family (MIP-1α, MIP–1β, RANTES) and IL-8(CXCL8). Bars represent median values and P-values were calculated using the Mann-Whitney U test, with * representing statistical significance for P-value <.05. (C) Representative flow cytometric plots of CLAD LTRs showing donor allospecific CD8+ BAL T cell effector responses. Values represent frequencies data of intracellular cytokine staining following re-stimulation with donor irradiated PBMC (right 2 panels) or medium alone (left 2 panels), (unstimulated) of IFNγ+, TNFα+, and CD107a+, from a subset of 6 LTRs with CLAD. (D) Pooled data from the same subset of six LTRs, with CLAD (red bars) and six LTRs with non-CLAD (blue bars) showing the ex vivo BAL CD8+ T cell frequencies for IFNγγ+, TNFα+, CD107a+, IL-2+, IL-17a+, and IL-13+ from 12 LTRs. Bars represent median values and P-values were calculated using the Mann-Whitney U test. (E) Representative flow cytometric plots of CLAD LTRs showing donor allospecific CD4+ BAL T cell effector responses. Values represent frequencies data of intracellular cytokine staining following re-stimulation with PBMC donor lysate (right 2 panels) or medium alone (left 2 panels), (unstimulated) of IFNγ+, TNFα+, and CD107a+, from a subset of six LTRs with CLAD. (F) Pooled data from the same subset of six LTRs, with CLAD (red bars) and six LTRs with non-CLAD (blue bars) showing the ex vivo BAL CD4+ T cell frequencies for IFNγ+, TNFα+, CD107a+, IL-2+, IL-17a+, and IL-13+ from 12 LTRs total. Bars represent median values and P-values were calculated using the Mann-Whitney U test
