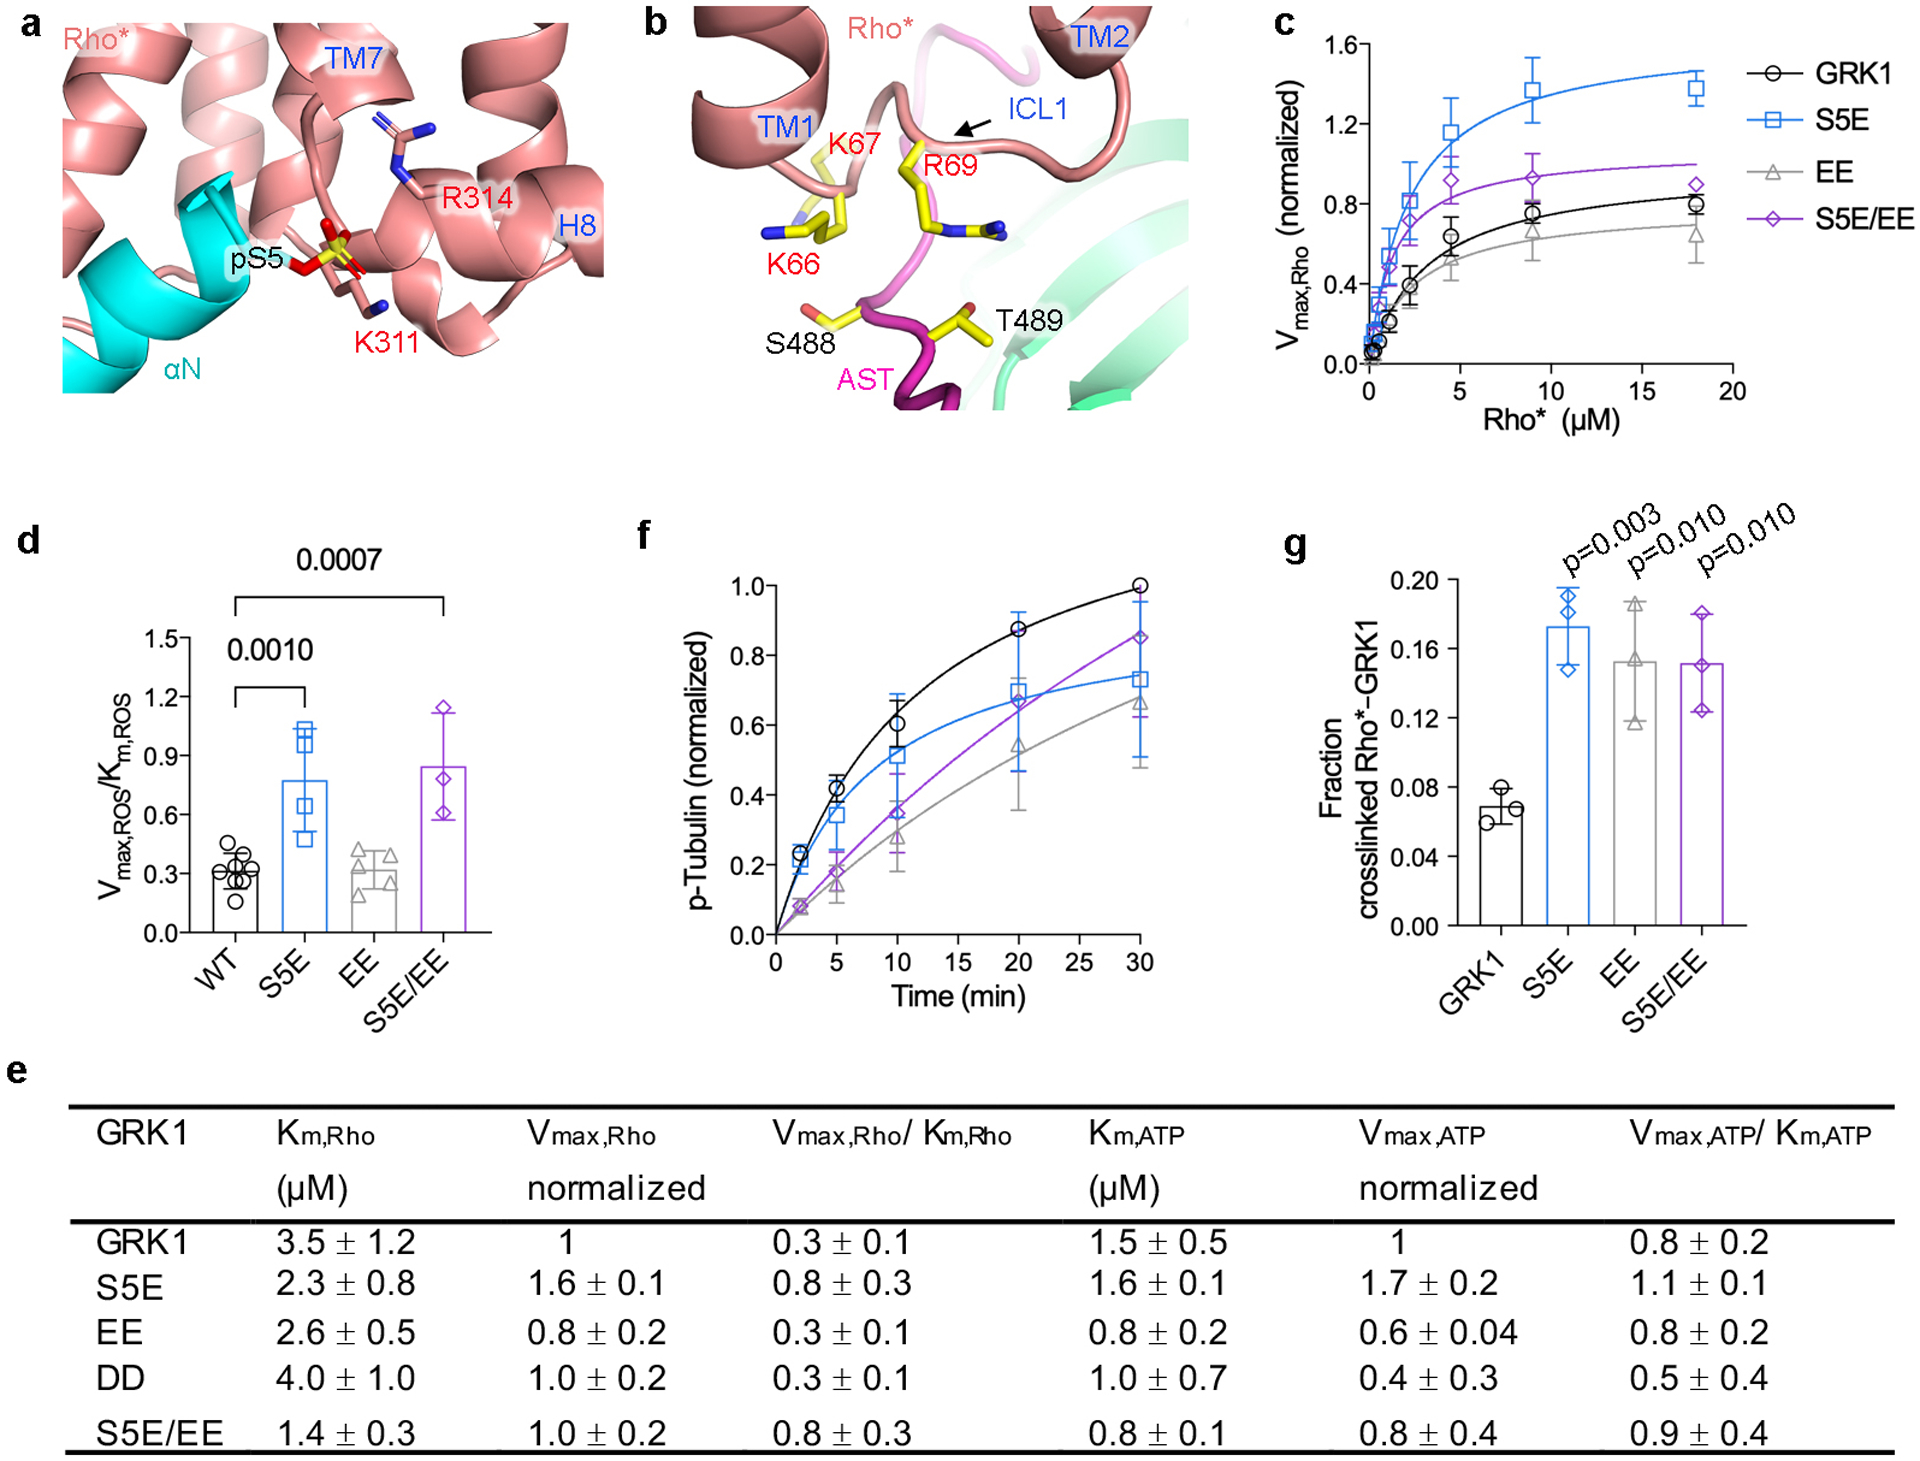
Extended Data Figure 8. Development of GRK1 autophosphorylation mimetic variants to aid in the structure determination of the Rho*–GRK1 complex.

a) Interactions of GRK1 αN with the cytoplasmic cleft and H8 of Rho*. GRK1-Ser5 was modeled in a phosphorylated state to demonstrate proximity with Rho*-Lys311 and Arg314. b) GRK1 AST interaction with ICL1. some of the key participating residues are shown with stick side chains. Ser488 and Thr489 are autophosphorylation sites in GRK1. c-e) Kinetic analysis of GRK1 and phosphomimetic mutant of Rho* phosphorylation: S5E; S488E and T489E (EE); S488D and T489D (DD); S5E, S488E, and T489E (S5E/EE). One-way ANOVA followed by Dunnett’s multiple comparison test was carried out to compare each mutant with GRK1. Reactions were performed in 50 mM HEPES (pH 8.0), 10 mM MgCl2 for 2 minutes at room temperature. Data was normalized to the Vmax,Rho or Vmax,ATP of GRK1. For Rho kinetics, S5E, n=4; EE, n=5; DD, n=3; S5E/EE, n=3. For ATP kinetics, S5E, n=3; EE, n=3; DD, n=4; S5E/EE, n=4. f) Time courses of tubulin phosphorylation by GRK1 and variants are similar. Data was normalized to the phosphorylation level of tubulin by GRK1 at 30 minutes (n=3). g) Crosslinking yield of GRK1 variants relative to GRK1 (n=3). For gel source data, see Supplementary Fig. 10g. Error bars in panels above represent standard deviation from three or more experiments.
