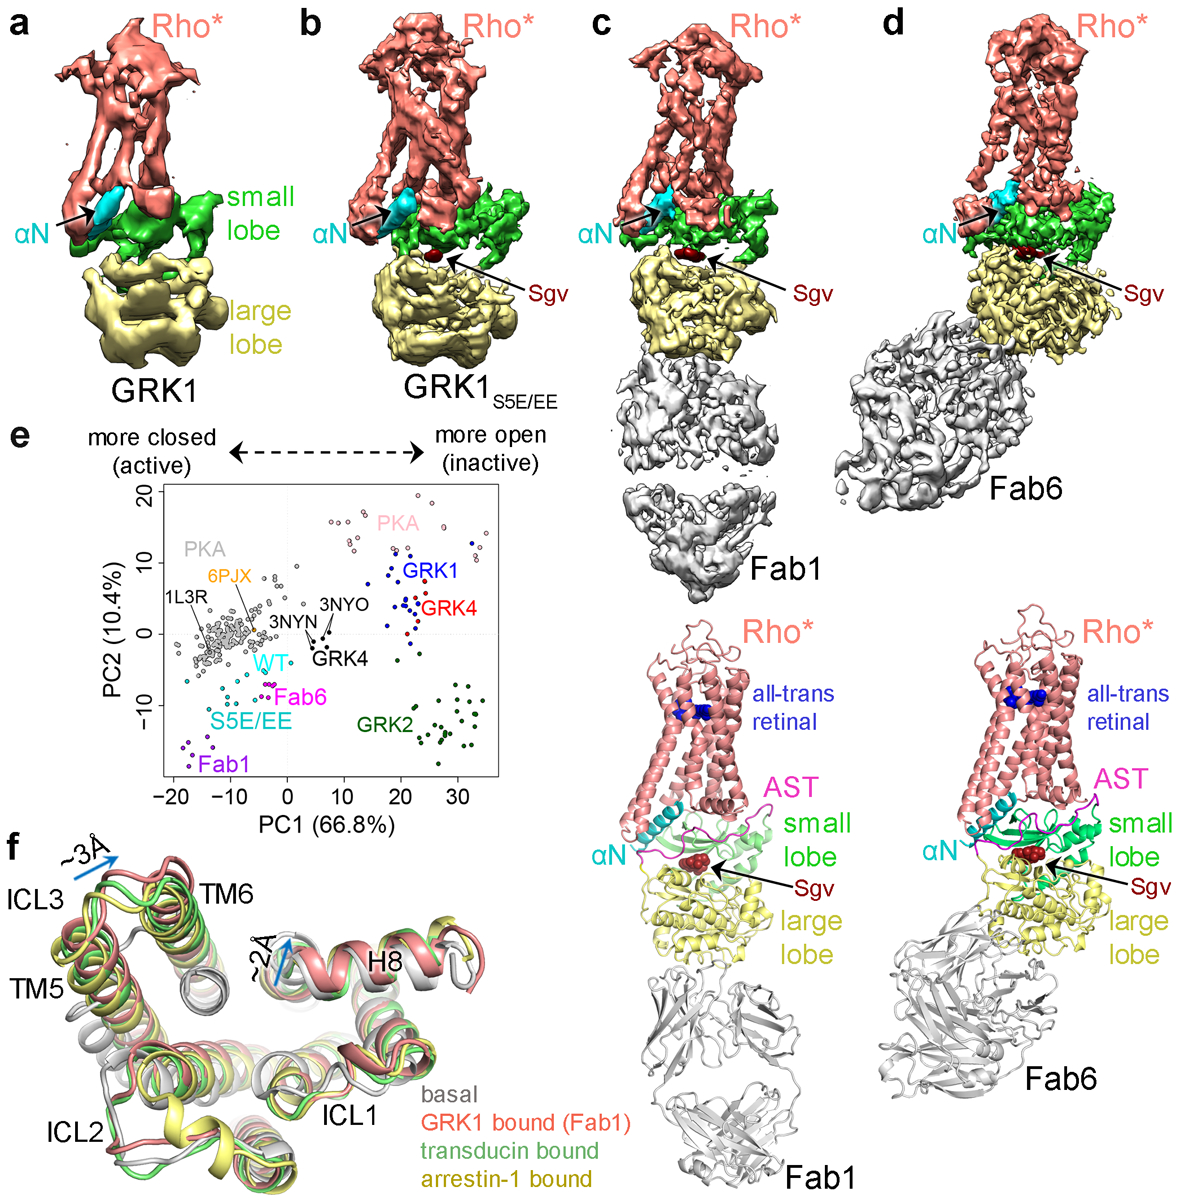
Figure 2. Cryo-EM single particle reconstructions reveal the prominent role of the GRK1 αN helix and AST in forming the interface with Rho*.

Sharpened maps of the 7 Å Rho*–GRK1 (a) and 5.8 Å Rho*–GRK1S5E/EE (b) complexes. Sharpened map and model of the Fab1–Rho*–GRK1S5E/EE complex (c) and the Fab6–Rho*–GRK1S5E/EE complex (d). e) Principal component (PC) analysis is consistent with a transition state-like conformation of the GRK1 kinase domain while in complex with Rho*. Each circle represents an individual experimental structure of PKA (grey active, pink inactive) or of the kinase domain from a member of one of the three GRK subfamilies: GRK1 (representing GRK1 and 7; various colors active, dark blue inactive), GRK2 (GRK2 and 3; green inactive), and GRK4 (GRK4, 5 and 6; black active, red inactive). Each structure was projected into the PC1-PC2 subspace, wherein PC1 and PC2 represent the directions with the largest conformational variance (67% and 10%, respectively). Molecular Dynamics Flexible Fitting (MDFF) models 1–6 (Supplementary Table 1) of Rho*–GRK1(WT) are colored cyan, those of Rho*–GRK1S5E/EE (S5E/EE) dark cyan, Rho*–GRK1S5E/EE–Fab1 (Fab1) magenta, and Rho*–GRK1S5E/EE−Fab6 (Fab6) purple. PDB entry 1L3R is the transition state-like structure of PKA, 3NYN/3NYO correspond to GRK6·Sgv/AMP complexes, and 6PJX is the Ca2+·CaM–GRK5 complex. PC1 and PC2 conformational changes are depicted in Supplementary Videos 3 and 4, respectively. f) Overlay of basal (PDB entry 1F8846), GRK1-bound (7MTA), transducin-bound (6OYA14), and arrestin-1 bound (5W0P32) Rho*. Key differences between GRK1-bound and transducin or arrestin-1-bound Rho* structures are indicated with arrows.
