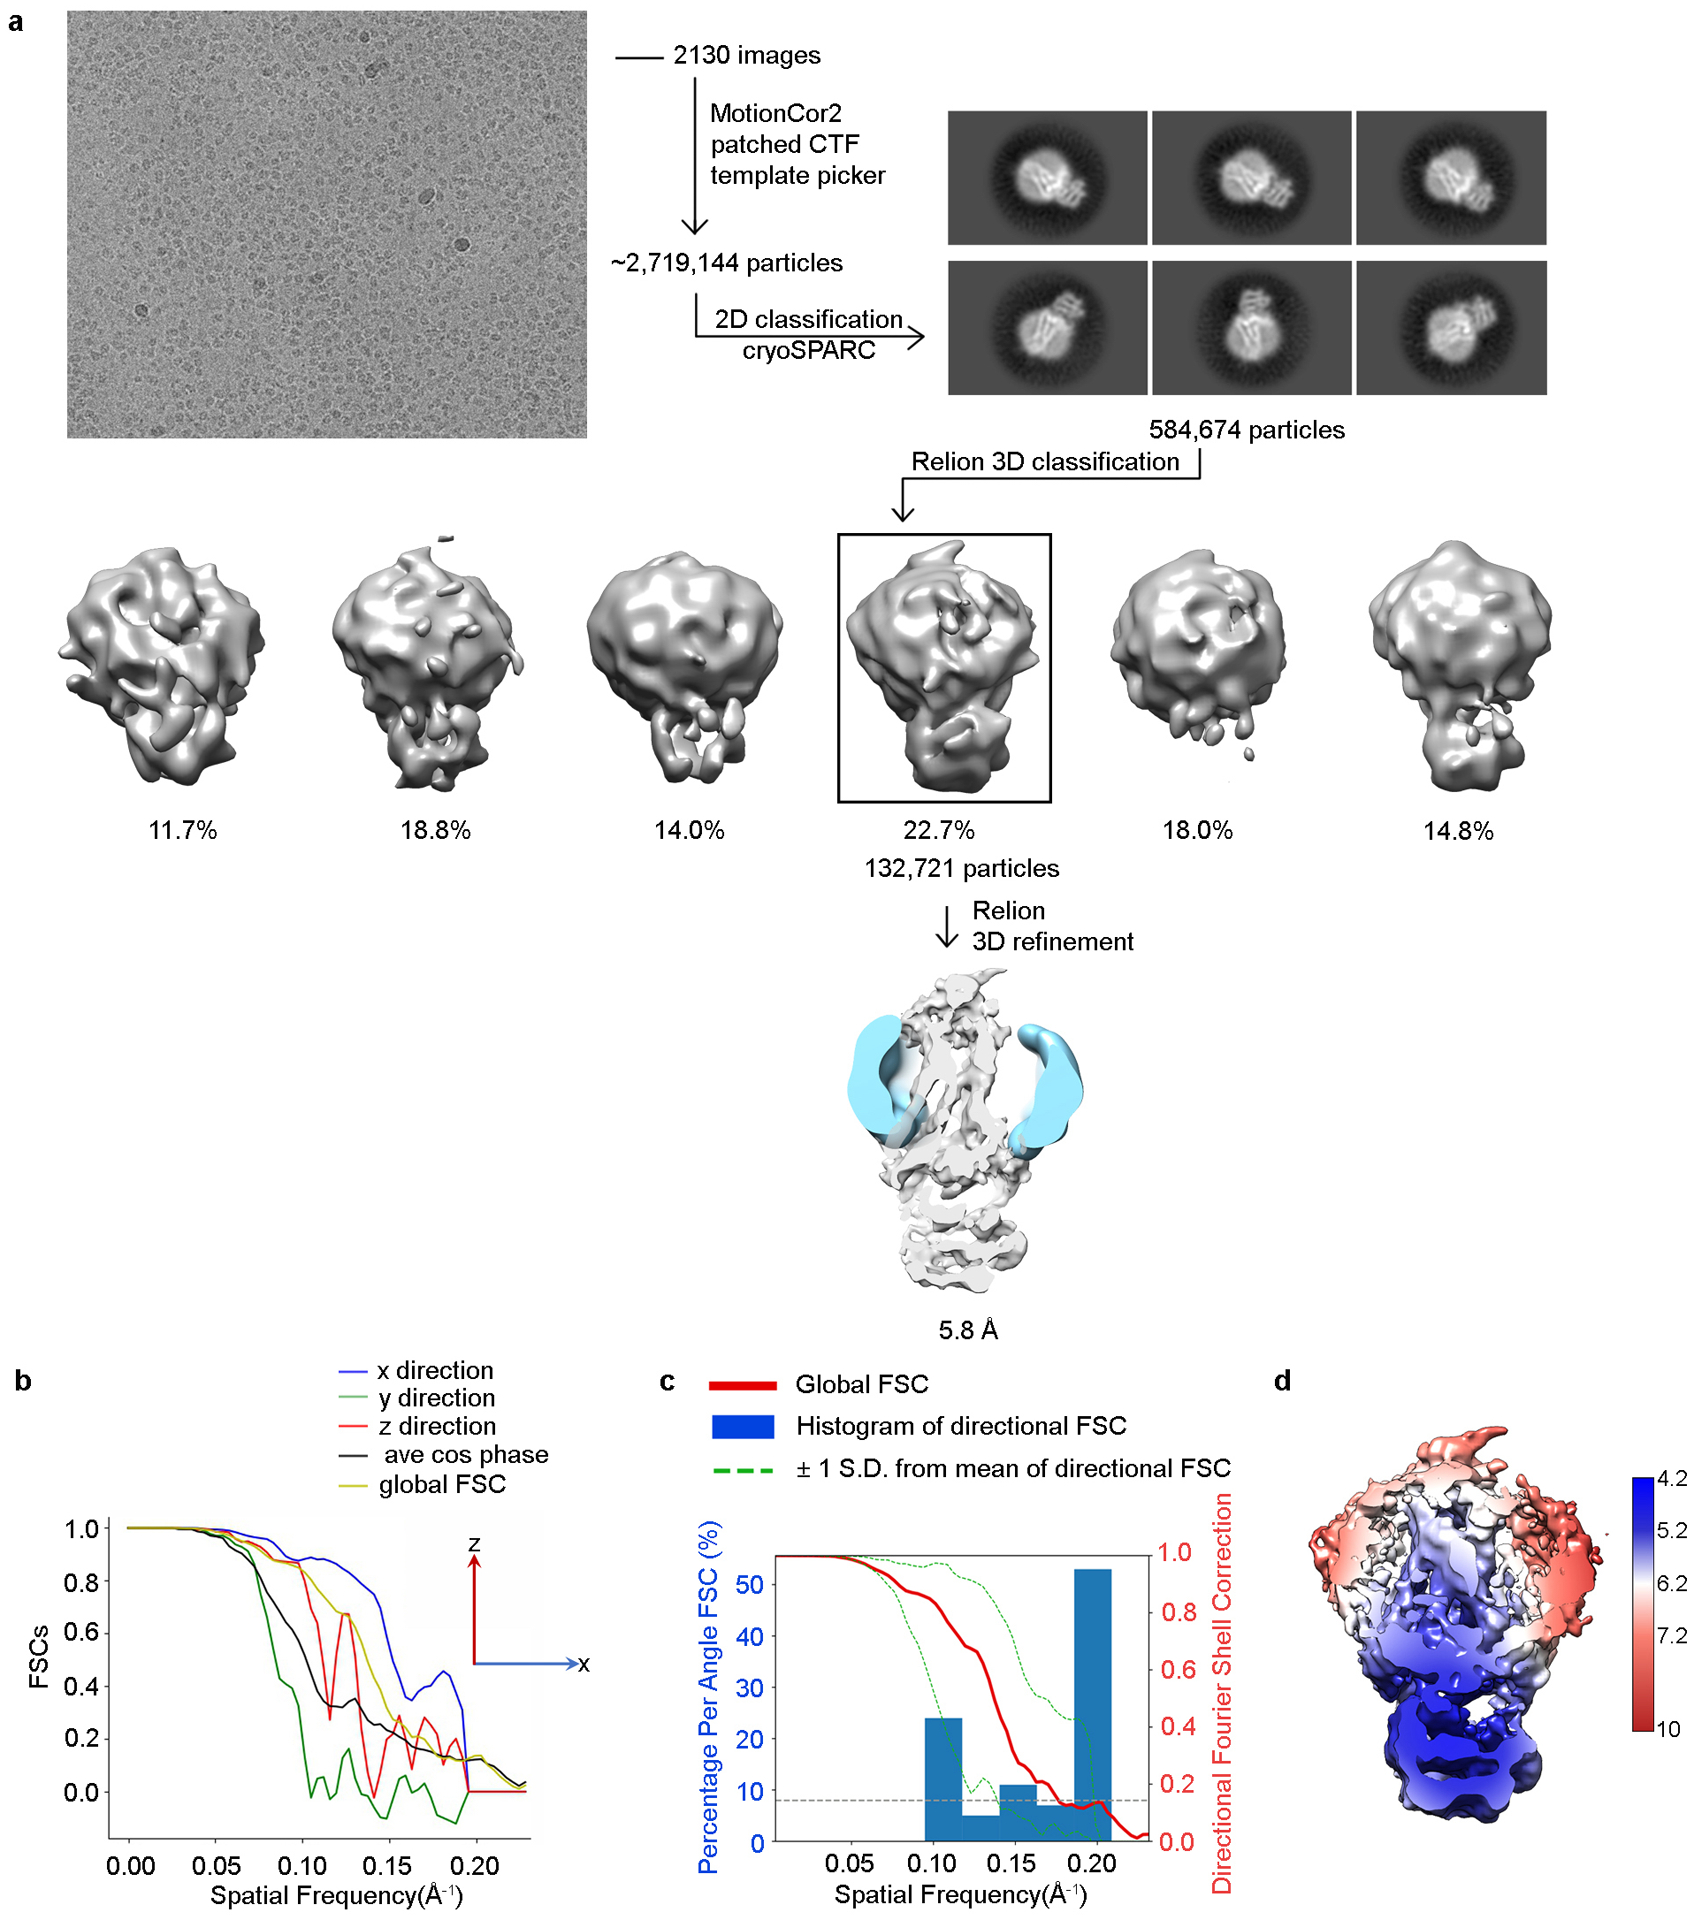
Extended Data Figure 3. Workflow of cryo-EM data processing and resolution analysis of Rho*–GRK1S5E/EE.

a) Representative raw cryo-EM micrograph from a total of 2,130. From these, 2.7 million particles were automatically picked in cryoSPARC and were used to generate 2D class averages (shown are representative good classes). After screening out bad classes, 585 thousand remaining particles were imported to RELION-3 and used to generate six major classes from 3D classification in RELION-3 using an initial model generated by cryoSPARC. Class 6 (132,721 particles) showed the best quality and was selected for 3D auto-refinement, resulting in a final map at a global resolution of 5.8 Å (FSC cut-off = 0.143). b) Directional FSC indicates that the resolutions in the x and z directions are similar to the global resolution, whereas the resolution in the y direction is lower. c) Plots of the global FSC together with the spread of directional resolution values defined by ±1 σ from the mean and a histogram of 100 such values evenly sampled over the 3D FSC. d) Local resolution map as estimated by RELION-3.
