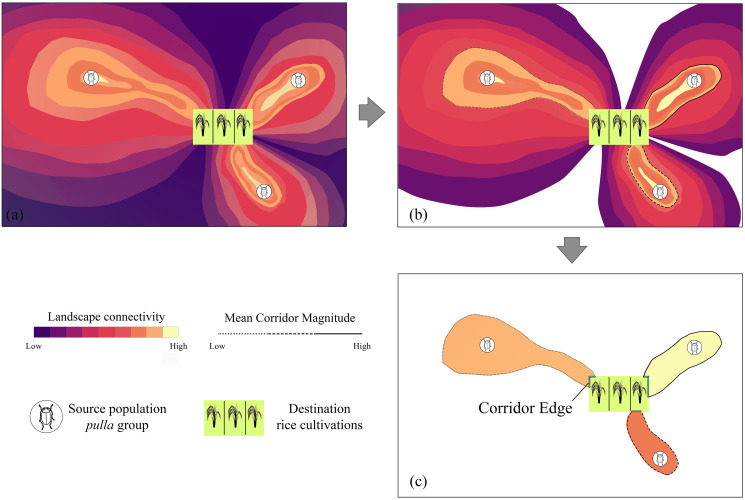
Figure 1. Mean Corridor Magnitude workflow.
The rationale of the workflow used to calculate the Mean Corridor Magnitude, with the total landscape connectivity among Chaetocnema pulla populations and rice cultivations (A) being discretized in single corridors (B) and converted into unique connectivity values, from C. pulla populations to rice cultivations, based on the mean connectivity value such obtained (Mean Corridor Magnitude) (C).

