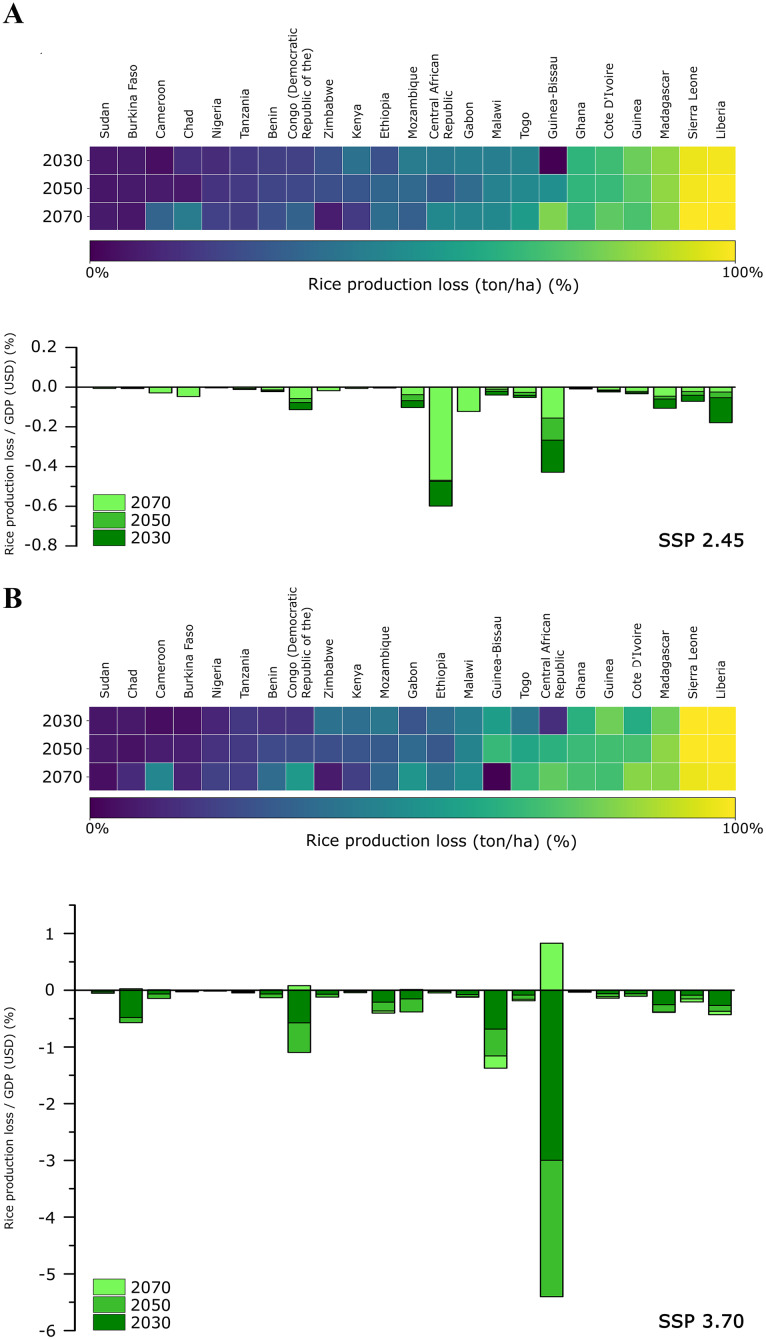
Figure 5. Losses in rice production and gross domestic product (GDP).
Heatmap of rice production loss (ton/ha * year) expressed as a percentage for each sub-Saharan country (for all future scenarios); stacked-bars of rice production loss in relation to GDP in USD (expressed in %) for each sub-Saharan country (all future scenarios considered). (A) SSP_2.45 scenario; (B) SSP_3.70 scenario.

