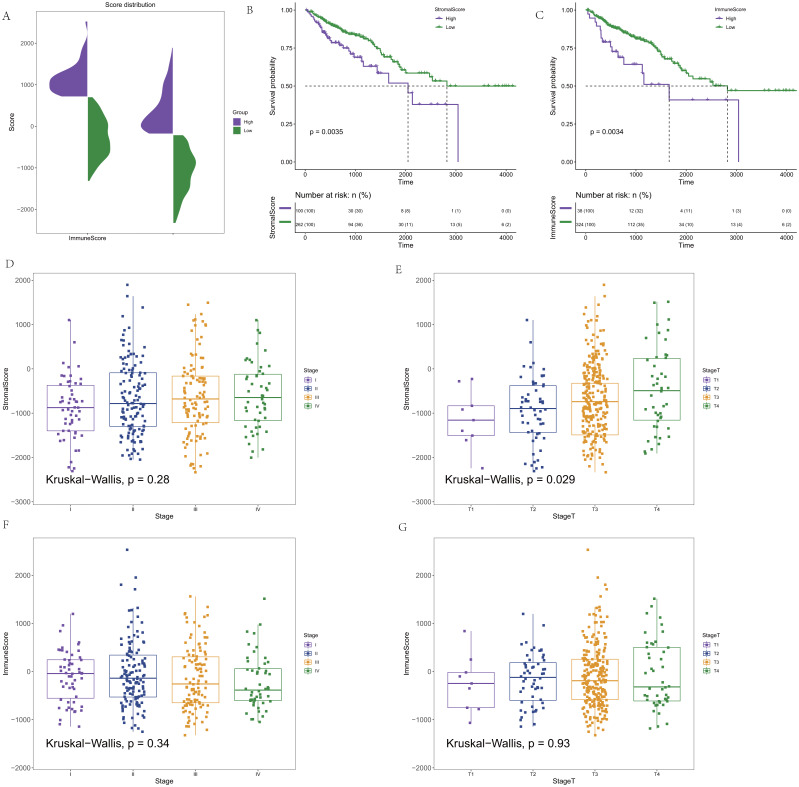
Figure 1. The score distribution and the Kaplan–Meier survival curves and the correlation of immune score and stromal score and the stage of CRC.
(A) The distribution of immune score and stromal score. (B) Kaplan–Meier survival curve based on stromal score. (C) Kaplan–Meier survival curve based on immune score. (D) The correlation of stromals core and the stage of CRC. (E) The correlation of stromal score and the stage T of CRC. (F) The correlation of immune score and the stage of CRC. (G) The correlation of immune score and the stage T of CRC.

