
Fig. 4. Treatment with the senolytic fisetin decreases mortality in NME-exposed old mice.
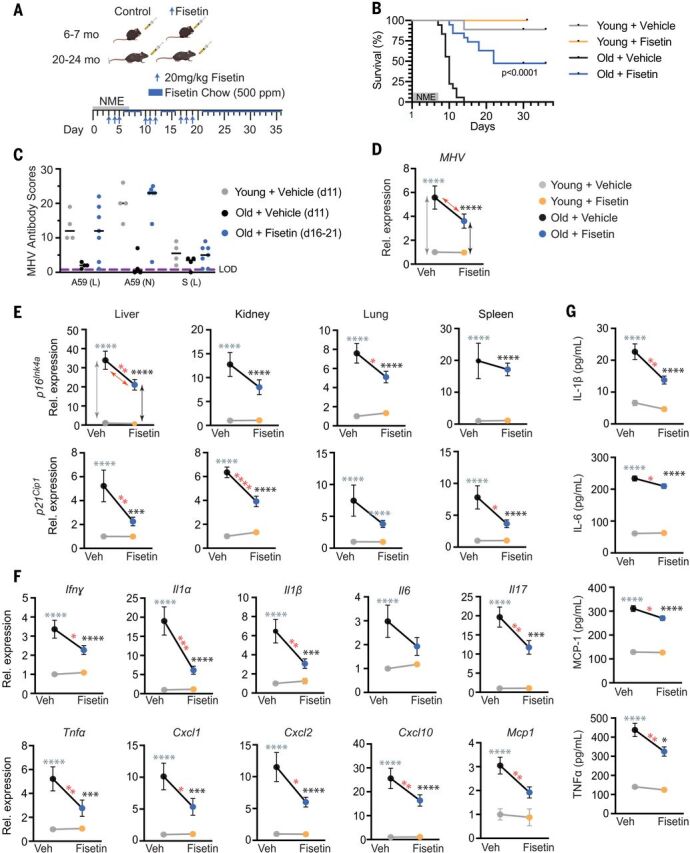
(A) Schematic of the experiment. Young (6 to 7 months) and old (20 to 24 months) mice were exposed to NME bedding containing mouse β-coronavirus MHV for 7 days. Mice were treated with 20 mg/kg/day Fisetin or vehicle only by means of oral gavage daily for 3 consecutive days starting on day 3 after initiation of NME. The 3 days of treatment were repeated (3 days on, 4 days off) for 3 weeks. Animals were also fed standard chow with Fisetin added (500 ppm) ad libitum after initiation of treatment. (B) Survival was measured for 36 days after initiation of NME (n = 9 young + vehicle; n = 5 young + Fisetin; n = 18 old + vehicle; n = 19 old + Fisetin). Log-rank (Mantel Cox) test. P < 0.0001 for old mice ± Fisetin. (C) Relative MHV antibody score in young and old mice in (B) on the indicated day after initiation of NME. (D to G) Young (2-month-old) and old (20-month-old) mice were exposed to NME bedding ± treatment with Fisetin as described in (A). On days 8 to 9 after initiation of NME, animals were euthanized, and tissues collected for measuring gene expression (n = 10 young + vehicle; n = 8 to 10 young + Fisetin; n = 10 to 11 old + vehicle; n = 13 old + Fisetin). All expression data were normalized to young mice treated with vehicle. Data are displayed as means ± SEM, two-way ANOVA and post-hoc comparison Tukey’s honestly significant difference used to compare the two animal cohorts within a treatment group. Arrows and asterisks: gray, vehicle-treated old versus young; black, Fisetin-treated old versus young; red, old ± Fisetin. *P < 0.05, **P < 0.01, ***P < 0.001, ****P < 0.0001. (D) MHV mRNA was quantified by means of quantitative PCR in fecal pellets collected from individual animals in (C). (E) Quantification of p16Ink4a and p21Cip1 mRNA in four tissues. (F) Quantification of SASP factor mRNA in liver. Data on other genes and tissues are available in fig. S9. (G) SASP protein levels in the liver measured with ELISA.