
FIGURE 2. Undifferentiated febrile illness in pediatric patients uniquely affects the frequencies of specific immune cell subsets.
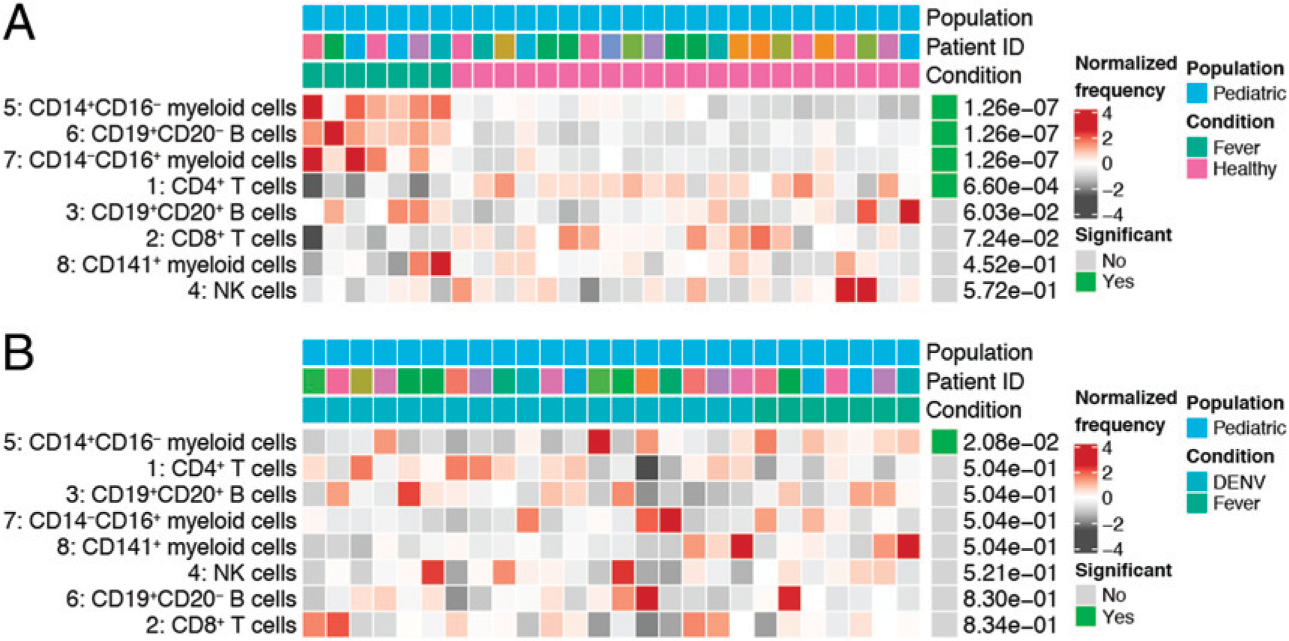
(A) Results from a differential abundance test comparing the frequencies of immune cell subsets in children presenting with an undifferentiated febrile illness (green, n = 7) to healthy children (pink, n = 22). (B) Results from a differential abundance test comparing the frequencies of immune cell subsets in DENV-infected children (teal, n = 19) and children presenting with an undifferentiated febrile illness (green, n = 7). Subsets whose frequencies were significantly different (adjusted p value < 0.05) between the two states are denoted by green boxes. The proportions of each cluster in each sample are represented by the normalized frequencies. Gray boxes correspond to underrepresentation and red boxes correspond to overrepresentation. The frequencies were scaled using arcsine-square-root transformation and then z-score normalized in each cluster (A and B).