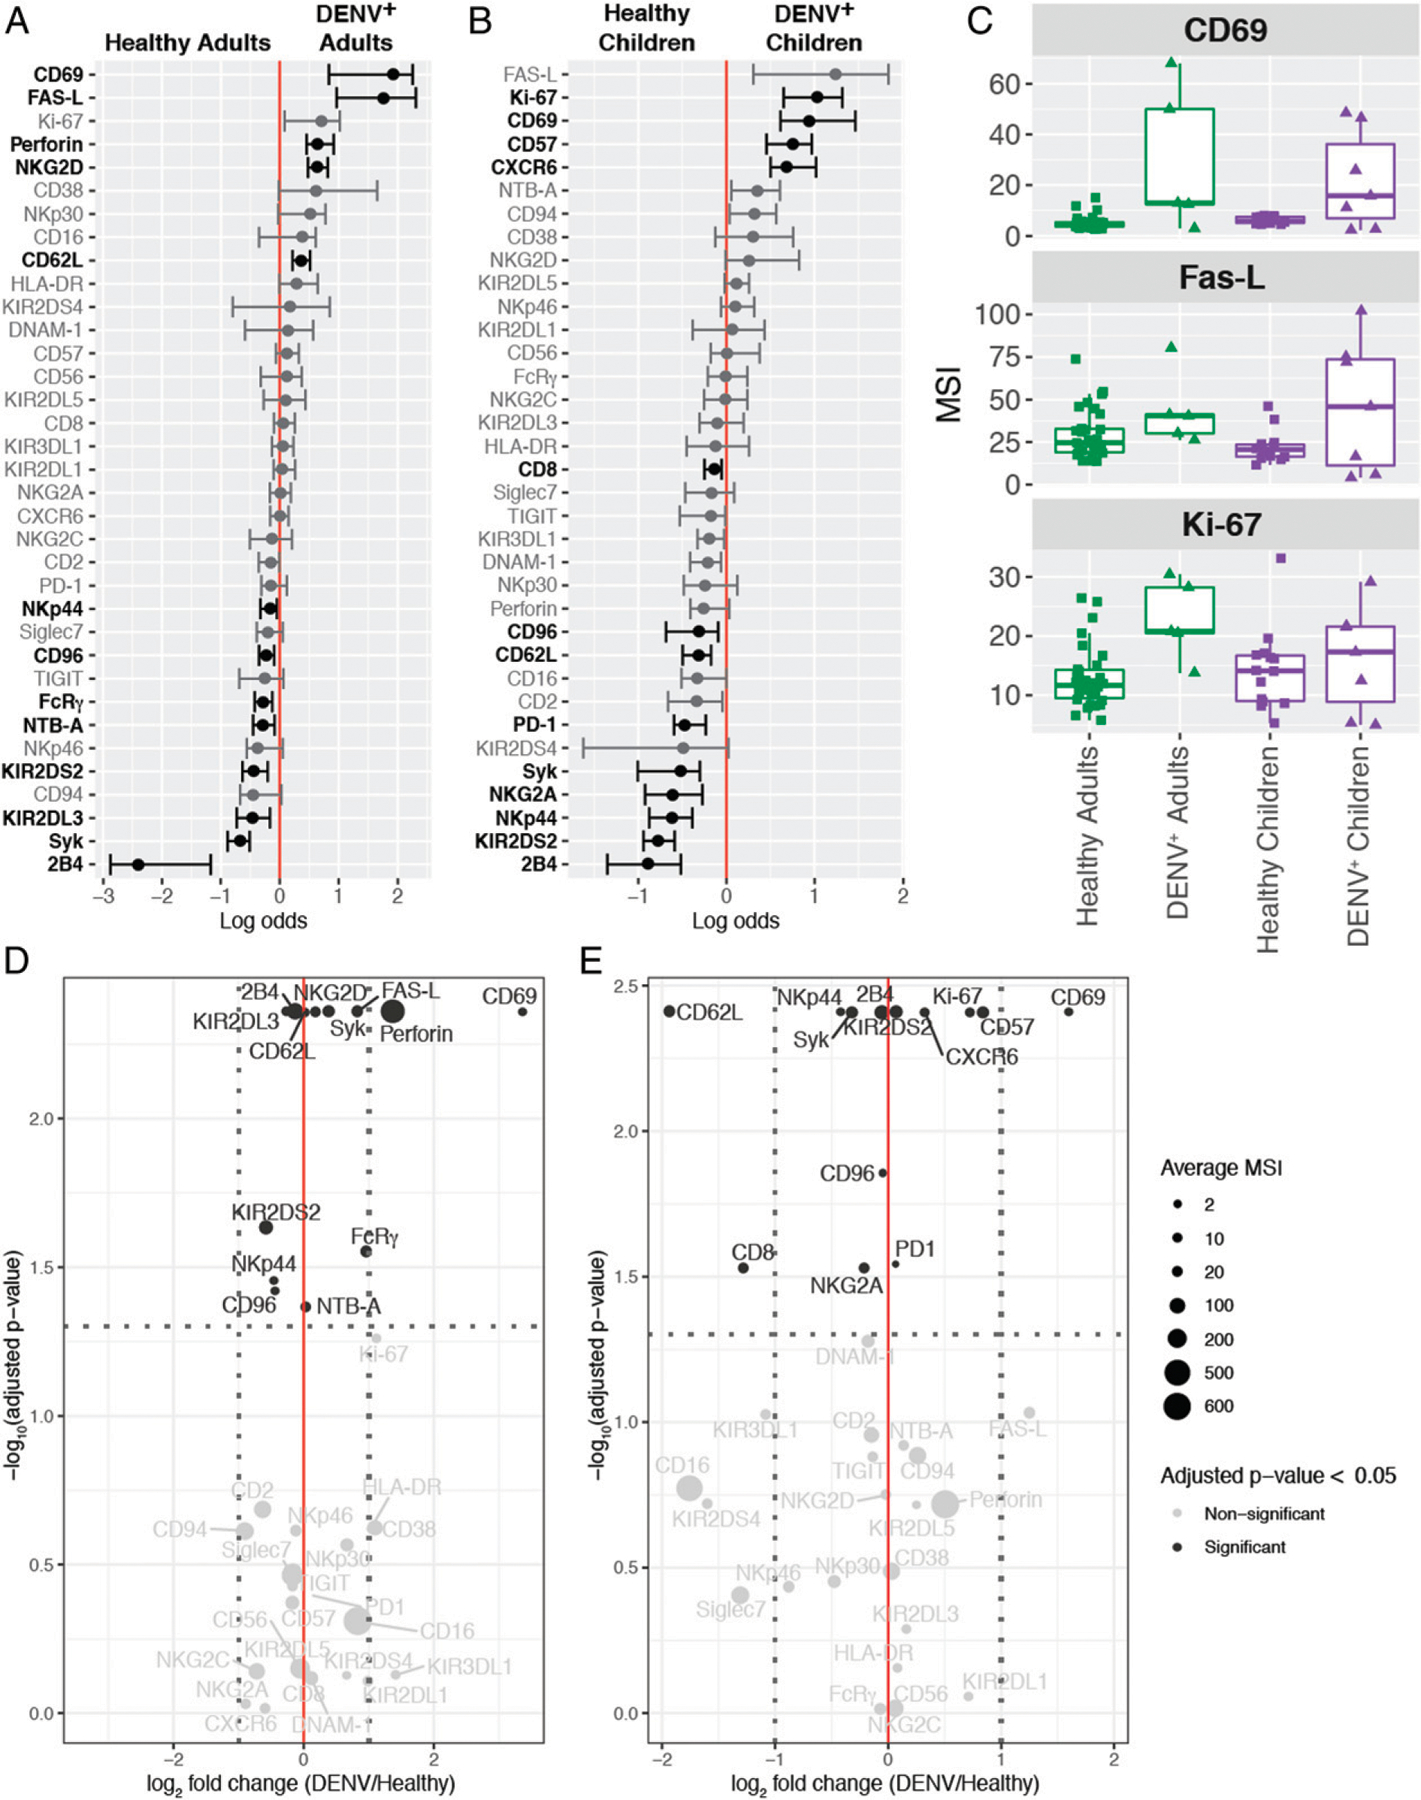
FIGURE 4. Acute DENV infection results in an activated NK cell phenotype in adults and NK cell maturation in children.

(A) A generalized linear model with bootstrap resampling was used to identify markers on total NK cells that were predictive of adult DENV infection (right, n = 5) and healthy adults (left, n = 30). Black bars represent the 95% confidence interval. (B) A generalized linear model with bootstrap resampling was used to identify markers on total NK cells that were predictive of pediatric DENV infection (right, n = 7) and healthy children (left, n = 14). Markers with an adjusted p value <0.05 are shown in black and markers with an adjusted p values >0.05 are shown in gray (A and B). (C) Box plots showing the MSI for the top three markers associated with DENV infection in both adults and children. Healthy adults (n = 30) are shown in green squares, DENV+ adults (n = 5) are shown in green triangles, healthy children (n = 14) are shown in purple squares, and DENV+ children (n = 7) are shown in purple triangles. (D) Volcano plot for adult NK cells illustrating markers whose adjusted p values in (A) were <0.05 in black and markers whose adjusted p values were >0.05 in gray. The horizontal dashed line marks the 0.05 p value cutoff. The −log10 p value for each marker is shown on the y-axis. The DENV/healthy log2 fold change for each marker is shown on the x-axis. The two vertical dashed lines provide a reference point for markers whose expression is increased 2-fold. The size of each point corresponds to the MSI for that specific marker. (E) Same as in (D), but for pediatric NK cells. The MSIs are assigned according to the key at the right and they correspond to the raw (untransformed) MSI. The reported p values are the adjusted p values generated by the generalized linear model with bootstrap resampling (D and E).
