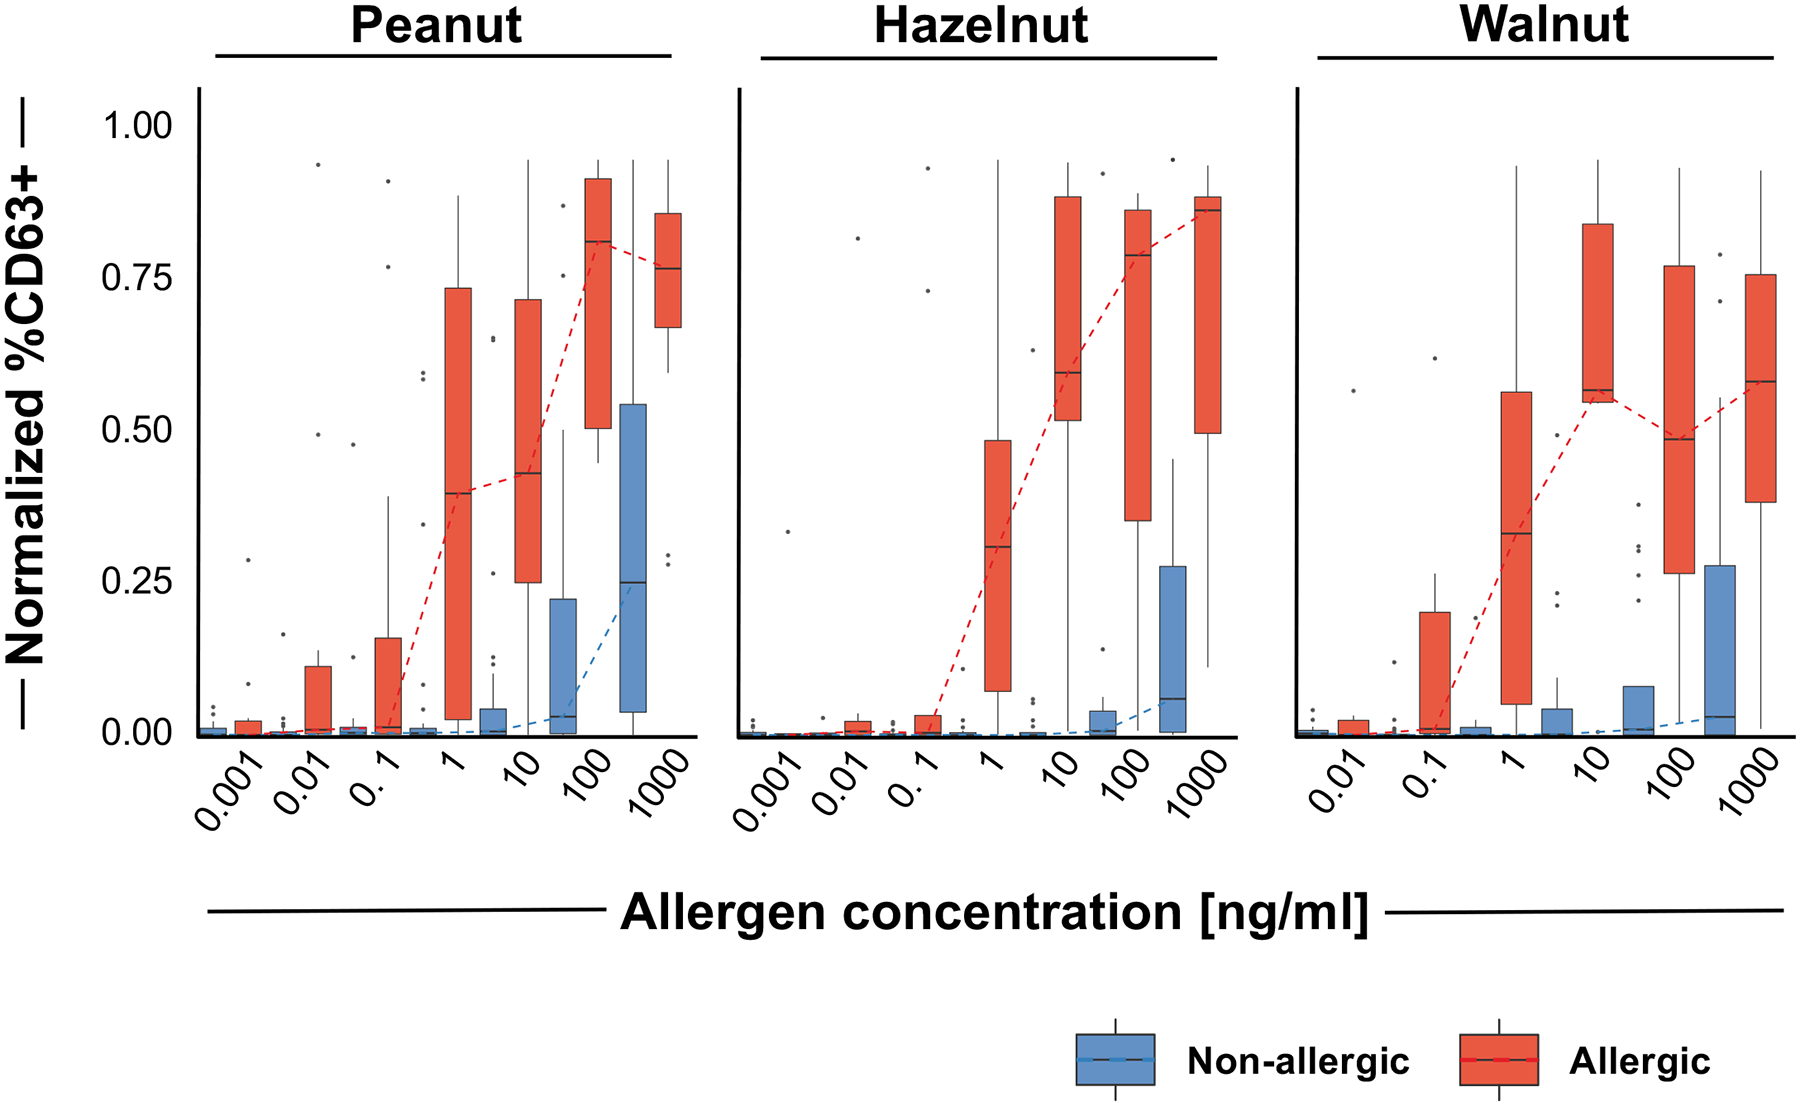
Figure 4. Basophil activation test distinguishes between OFC-positive and OFC-negative patients in those who underwent OFCs:

Boxplots depicting the distribution of normalized %CD63+ basophils for samples with OFC outcomes for peanut, hazelnut, or walnut at each concentration (0.001 to 1000 ng/mL). OFC positive samples are depicted in red and OFC negative samples are depicted in blue.
