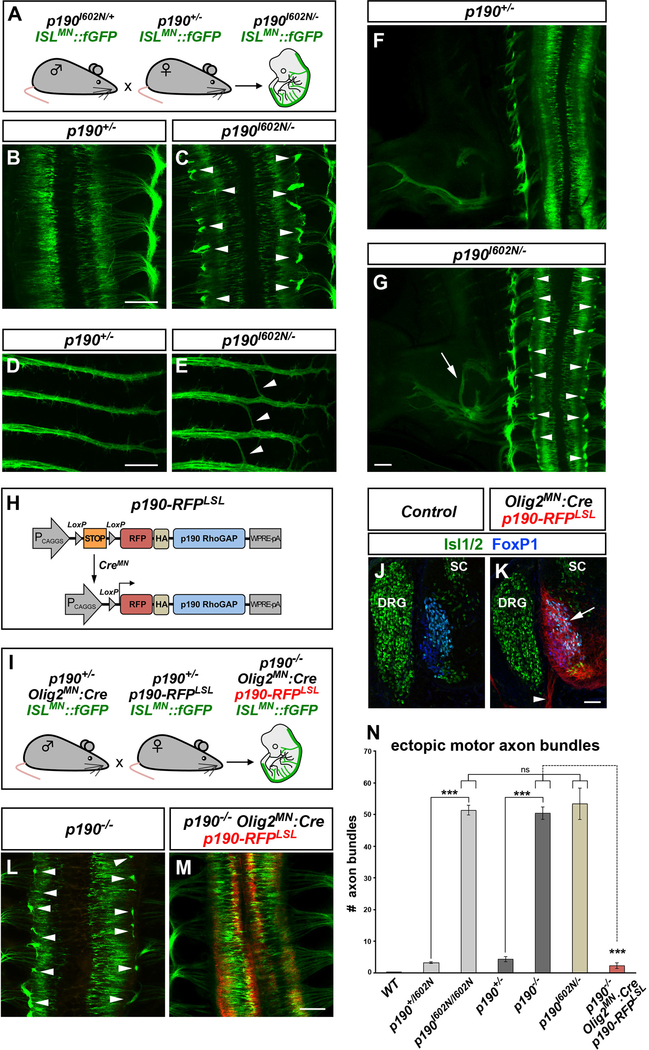
Figure 2. p190 Is Required within Motor Neurons for Axon Pathfinding.
(A) Transgenic mouse crosses to test complementation of ENU allele p190I602N and p190 knockout allele.
(B–G) Whole-mount images of ISLMN::fGFP in E12.5 single (p190+/−) (B, D, and F) or compound heterozygous (p190I602N/−) (C, E, and G) embryos. Compound heterozygotes display ectopic motor axon bundles (arrowheads in C), aberrant “bridging” of intercostal nerves (arrowheads in E) and hindlimb nerve guidance errors (arrow in G) as found in both Cassin (p190I602N/I602N) and p190 homozygous mutants (see Figures 1B and 1D). Arrowheads in (G) point to ectopic bundles.
(H) Transgenic strategy for conditional expression of p190. Cre removes the poly(A)-STOP cassette allowing expression of RFP-tagged p190.
(I) Mouse crosses to test the requirement of p190 in motor neurons. Transgenic p190-RFP is driven by Olig2MN::Cre in ISLMN::fGFP+ motor neurons of p190 knockout embryos.
(J and K) Restricted expression of p190-RFP in motor neuron cell bodies (arrow) and axons (arrowhead) in transverse sections of Olig2MN::Cre-positive (K) but not in Cre-negative control embryos (E12.5) (J). SC, spinal cord; DRG, dorsal root ganglia.
(L and M) Whole-mount images of ISLMN::fGFP reporter (E12.5). Motor axon exiting defects of p190−/− embryos (arrowheads in L) are corrected by expression of p190-RFP in motor neurons (M).
(N) Quantification of ectopic ISLMN::fGFP+ motor axon bundles in embryo whole mounts. Mean ± SEM; Mann-Whitney U test, ***p < 0.001 p190I602N/I602N and p190−/− versus heterozygous; p190−/− versus p190−/−;Olig2MN::Cre;p190-RFPLSL; Tukey’s multiple comparisons test, ns, p > 0.05 p190I602N/− versus p190I602N/I602N and p190−/−. The number of analyzed embryos is reported in the Supplemental Information.
Scale bars in (B)–(M), 200 μm, and in (J) and (K), 50 μm. See also Figure S2.

