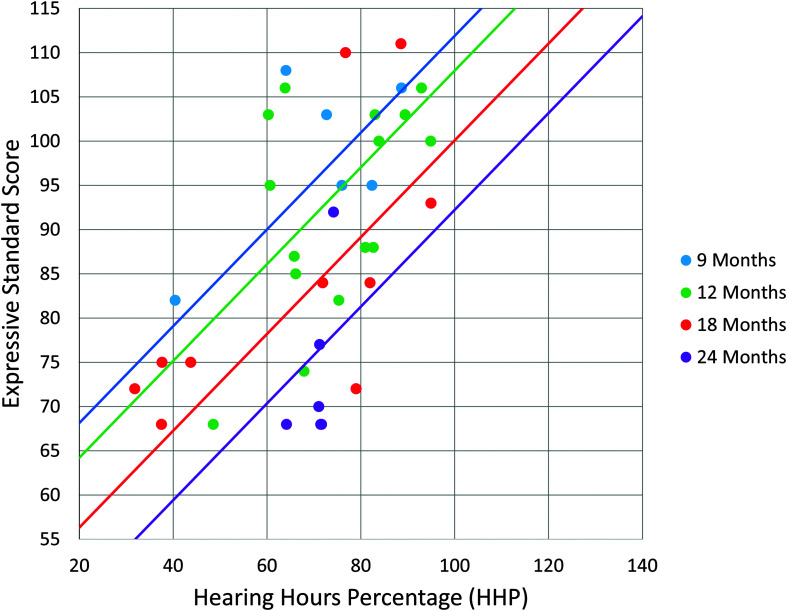
Figure 2.
This graph displays the predicted expressive language standard score based on cumulative HHP and age at implantation. Normal range for standard scores is 85–115. The four regression lines account for the differences in age at implantation. These have the same slope but a different intercept, meaning that increased cumulative HHP is required with increased age at implantation.

