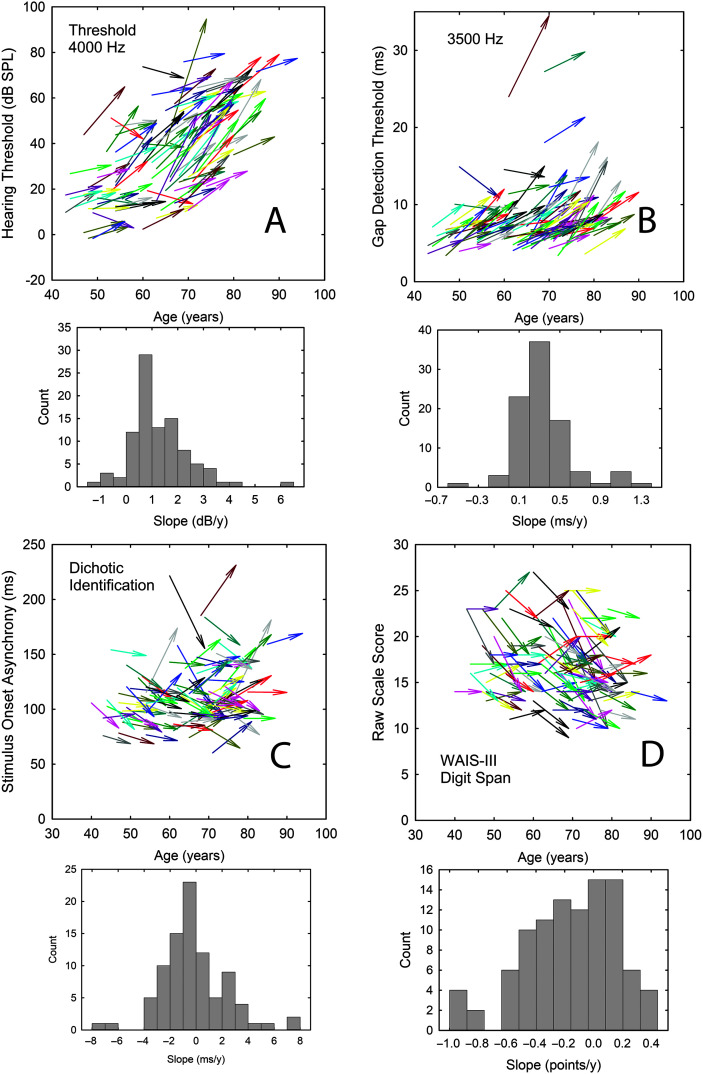
Figure 8.
Examples of individual longitudinal data illustrating change from baseline (T1) to follow-up (T2) via individual colored arrows top panels of each pair and ensuing histogram of resulting slopes for that same measure (gray bars in bottom panel of each pair). Representative data are shown for one case of each of the three types of auditory psychophysical measures (A: pure-tone hearing threshold at 4000 Hz; B: gap-detection threshold at 3500 Hz; C: temporal order, dichotic identification) and Wechsler Adult Intelligence Scale–Third Edition (WAIS-III)\ raw scores (D: digit span).

 This work is licensed under a