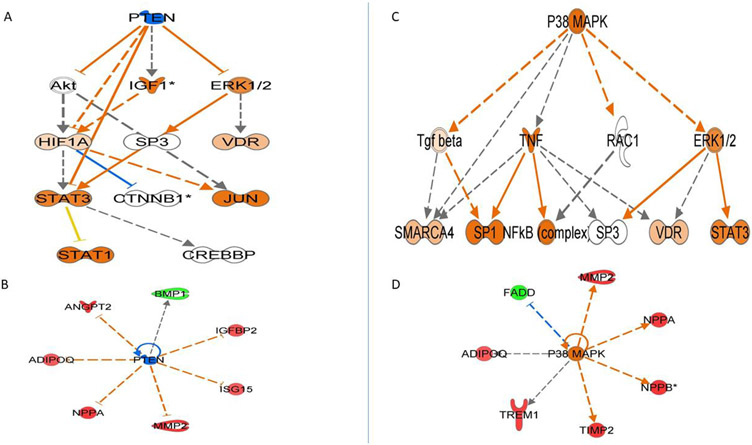
Figure 3.
The top upstream regulators identified using IPA, based on experimentally observed relationships between regulators and genes or gene products. Panel A depicts the hierarchical associations between PTEN and its expected downstream regulators to produce the associations we observe in the proteins in Panel B. Panel C depicts the hierarchical associations we would expect between P38 MAPK and intermediate regulators to produce the effects on the proteins observed in Panel D. Orange nodes are when leading the activation of the downstream node, blue nodes are predicted to be inhibited, and white nodes represent IPA predicted molecules with non-consistent activation patterns. Red nodes are upregulated proteins, green nodes are downregulated proteins. Edges connecting the nodes are colored orange when leading to activation, blue when leading to inhibition, and yellow if the findings underlying the relationship are inconsistent with the state of the downstream node.

