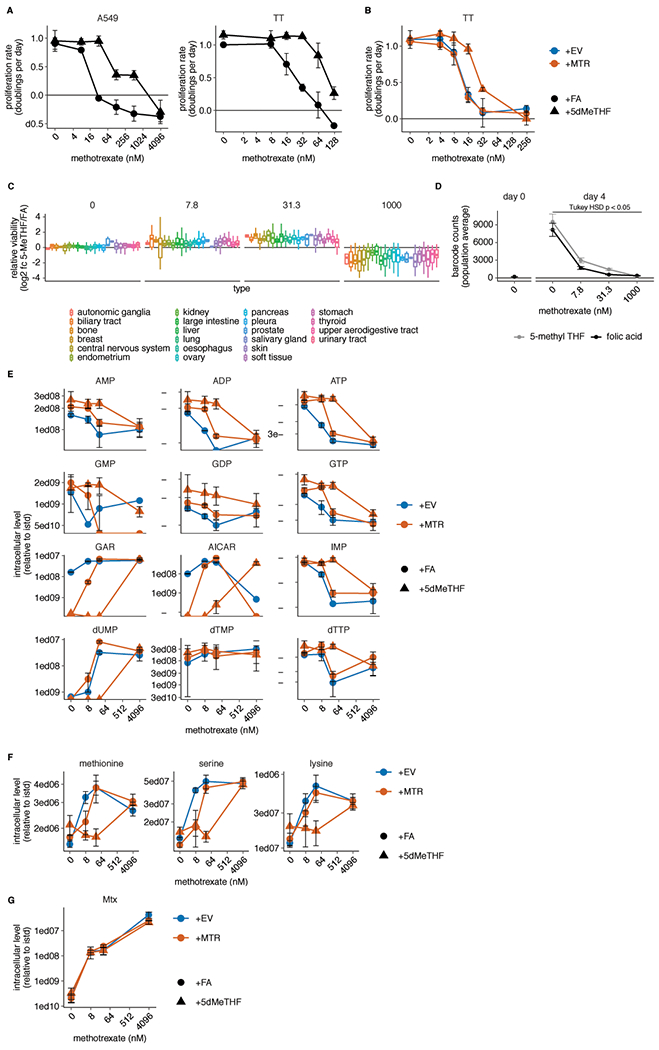
Extended Data Fig. 5. 5-methyl THF medium blunts methotrexate efficacy but not import.

(A-B) Proliferation rates of A549 and T.T cells (A) or T.T MTR knockout cells without (+EV) or with MTR expression (+MTR) (B) cultured in folic acid (+FA) or 5-methyl THF (+5-MeTHF) for 4 days across a range of methotrexate doses (n = 3 independent samples). (C) Log2 fold change in relative viability of 489 cell lines cultured in 5-methyl THF versus folic acid as in A-B (log2 fc 5-MeTHF/FA) at the indicated methotrexate doses, grouped by tissue of origin (note that the 0 dose is the same data plotted in Fig. 1G). Median (box center line), interquartile range (IQR) (box), and 1.5*IQR (whiskers) are plotted. (D) Mean barcode read counts for the total pool of cancer cell lines, before (day 0) or after (day 4) culture in the indicate folate/methotrexate doses as in A-B. Tukey HSD p-value was calculated by correcting a two-way ANOVA test for multiple comparisons between the dose response curves in the two folates (n = 489 cell lines; folic acid vs. 5-methyl THF dose response p = 0.049). (E-G) LC/MS measurement of intracellular AMP, ADP, ATP, GMP, GDP, GTP, GAR, AICAR, IMP, dUMP, dTMP, dTTP (E), methionine, serine, lysine (F), and intracellular methotrexate (Mtx) (G) levels in A549 MTR knockout cells +EV or +MTR cultured in the indicated folate across a range of doses of methotrexate as in A-B (n = 3 independent samples). Data are normalized to cell number and an internal standard. (A-G) Mean +/− SD error bars are displayed, except in D where mean +/− SEM is displayed.
