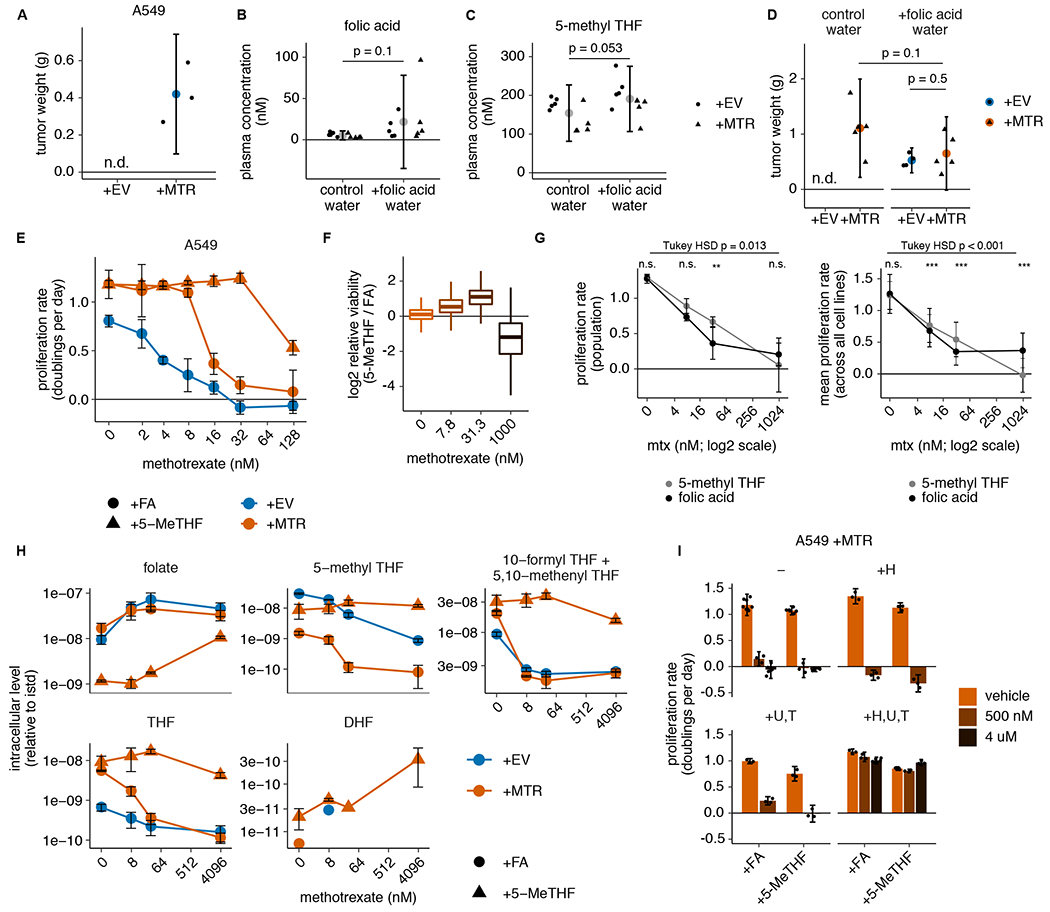
Figure 5. Physiological folates prevent growth of MTR knockout tumors and cause methotrexate resistance.

(A) Tumor weight of subcutaneous xenografts generated by injection of 100,000 A549 MTR knockout cells without (+EV) or with (+MTR) MTR expression into the flanks of NSG mice. Tumors were harvested after 4 months (n=3 mice per condition; n.d.: not detected). (B-C) Plasma concentration of folic acid (B) and 5-methyl THF (C) in NSG mice provided with unlimited water (control water) or water containing 0.1 g/L folic acid (+folic acid water) for 3 weeks (n=10 mice per condition; folic acid p = 0.1; 5-methyl THF p = 0.053). (D) Tumor weight of subcutaneous xenografts formed by injecting 1,000,000 A549 MTR knockout cells +EV or +MTR into the flanks of NSG mice provided with control or folic acid water as in B-C since the day of injection. Tumors were harvested after 3 months (n=5 mice per condition; +MTR control vs. folic acid water p = 0.1, +EV vs +MTR folic acid water p = 0.5; n.d.: not detected). (E) Proliferation rates of A549 MTR knockout cells +EV or +MTR cultured in folic acid (+FA) or 5-methyl THF (5-MeTHF) for 4 days across a range of methotrexate doses (n = 3 independent samples). (F) Overall population log2 fold change in relative viability of 489 cell lines cultured in 5-methyl THF versus folic acid as in E at the indicated methotrexate doses. Median (box center line), interquartile range (IQR) (box), and 1.5*IQR (whiskers) are plotted (n = 489 cell lines). (G) Overall pooled 489 cell line population bulk proliferation rate in doublings per day (left panel, n = 4 measurements of 1 pooled sample; overall folic acid vs. 5-methyl THF dose-response p-value = 0.013, pairwise comparison adjusted p-values: 0 nM p = 1, 7.8 nM p = 0.233, 31.3 nM p = 0.001, 1000 nM p = 0.28) and averaged proliferation rates across all cell lines (right panel, n = 489 cell lines; overall folic acid vs. 5-methyl THF dose-response p-value = 3.5*10−5, pairwise comparison adjusted p-values: 0 nM p = 0.85, 7.8 nM p = 5.2*10−5, 31.3 nM p ~ 0, 1000 nM p ~ 0) cultured in 5-methyl THF or folic acid as in E at the indicated methotrexate doses. Tukey HSD and pairwise comparison p-values at each dose were calculated by correcting a two-way ANOVA test for multiple comparisons between the dose response curves in the two folate sources. (H) LC/MS measurement of intracellular folate, 5-methyl THF, combined 5,10-methenyl THF/10-formyl THF, THF, and DHF levels in A549 MTR knockout cells +EV or +MTR cultured in the indicated folate as in E across a range of methotrexate doses (n = 3 independent samples). Data are normalized to protein concentration and an internal standard. (I) Proliferation rates of A549 MTR knockout cells +MTR cultured in the indicated folate as in E with or without the addition of 100 μM each of the indicated nucleotide precursors hypoxanthine (H), uridine (U), and thymidine (T), as well as methotrexate or vehicle (DMSO) (n = 3 independent samples except n=6 for samples +FA − vehicle, − 4 uM, and +H,U,T +4 uM and +5-MeTHF − vehicle). For the +H and +U,T conditions, only the lower dose (500 nM) of methotrexate was assessed. (A-I) Mean +/− SD error bars are displayed. p-values are derived from a two-tailed, unpaired Welch’s t test except as otherwise indicated in G (* = p < 0.05, ** = p < 0.01, *** = p < 0.001).
