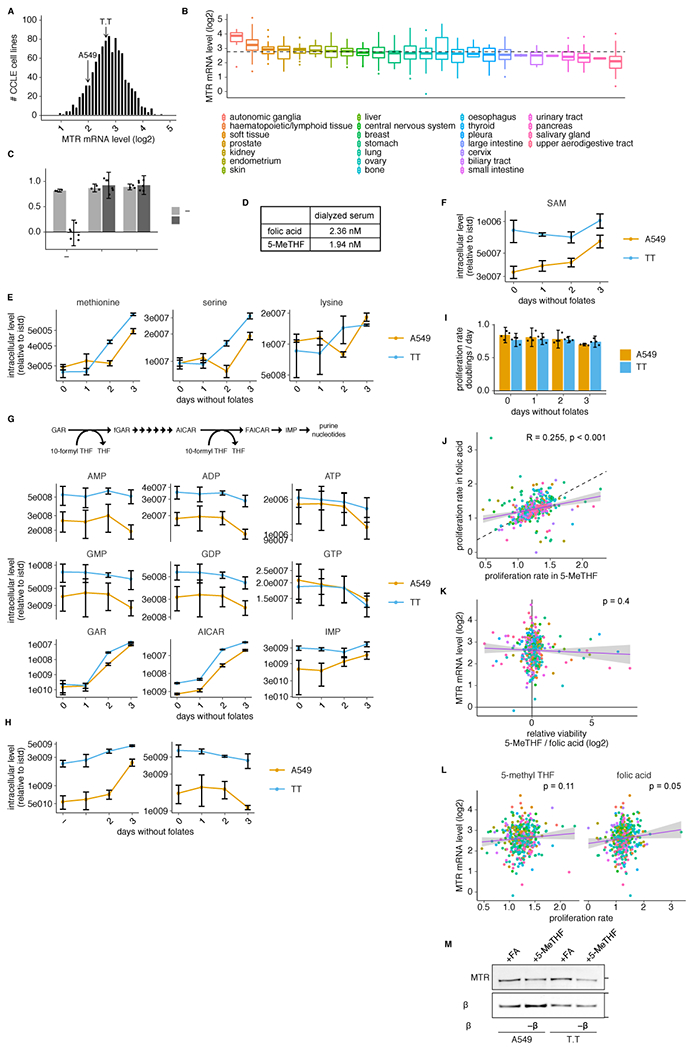
Extended Data Fig. 1. Characterization of cells cultured in 5-methyl THF.

(A-B) Histogram (A) or box plot (B) of log2 MTR mRNA levels for cells in the Cancer Cell Line Encyclopedia (CCLE)24 (n = 1019/1457 cell lines with detectable MTR). Median (box center line), interquartile range (IQR) (box), 1.5*IQR (whiskers), and outliers (points) are plotted; dashed line represents the overall median. (C) Proliferation rate of T.T cells in media containing no folate source (−), folic acid (+FA), or 5-methyl THF (+5-MeTHF) before (0 days, n = 3 independent samples) or after (3 days, n = 6 independent samples) of culture with no folic acid (“prestarved”). (D) LC/MS measurement of folic acid and 5-methyl THF concentrations in dialyzed fetal bovine serum. (E-H) LC/MS measurement of intracellular methionine, serine, lysine (E), SAM (F), AMP, ADP, ATP, GMP, GDP, GTP, GAR, AICAR, IMP (G), dUMP and dTMP (H) in A549 and T.T cells cultured for up to 3 days in medium lacking folates (n = 3 independent samples). Data are normalized to protein concentration and an internal standard. (I) Proliferation rate of A549 or T.T cells cultured in medium lacking folates for up to 3 days (n = 4 independent samples). (J-L) Correlation between the proliferation rate in 5-methyl THF and folic acid medium (J; dashed line: y=x), log2 MTR mRNA level and log2 relative viability in 5-methyl THF versus folic acid medium (K), or log2 MTR mRNA level and proliferation rate in 5-methyl THF / folic acid (L) for 489 barcoded cell lines (Pearson’s product moment correlation coefficient / p-value for J: R = 0.255, p = 2e-07; K: R = −0.041 p = 0.4; L: 5-methyl THF R = 0.08, p = 0.11 and folic acid R = 0.1, p = 0.05). Purple line is a linear regression fit, shading represents a 95% confidence interval around the mean. (M) Western blot analysis of MTR expression in A549 or T.T cells cultured in medium with the indicated folate source (representative of 1 experiment). (A-M) Mean +/− SD error bars are displayed.
