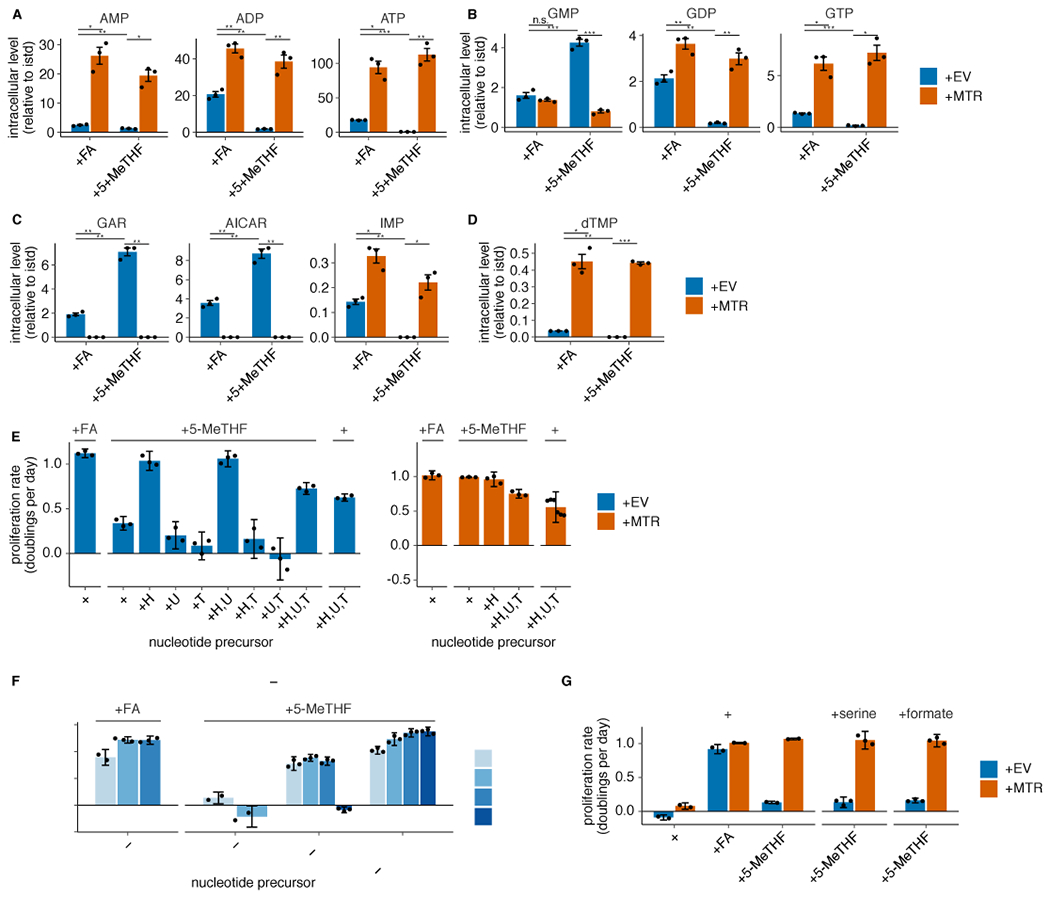
Extended Data Fig. 3. MTR knockout results in folate insufficiency and impaired nucleotide synthesis in 5-methyl THF.

(A-D) LC/MS measurement of intracellular AMP, ADP, ATP (A), GMP, GDP, GTP (B), GAR, AICAR, IMP (C), and dTMP (D) levels in T.T MTR knockout cells without (+EV) or with MTR expression (+MTR) cultured for 4 days in folic acid (+FA) or 5-methyl THF (+5-MeTHF) after a prestarvation period (n = 3 independent samples; +EV +FA vs +MTR +FA p-values: AMP: 0.014, ADP: 0.002, ATP: 0.014, GMP: 0.26, GDP: 0.008, GTP: 0.017, GAR: 0.004, AICAR: 0.005, IMP: 0.014, dTMP: 0.01; +EV +5-methyl THF vs +MTR +5-methyl THF p-values: AMP: 0.012, ADP: 0.0097, ATP: 0.007, GMP: 0.0006, GDP: 0.008, GTP: 0.012, GAR: 0.002, AICAR: 0.003, IMP: 0.022, dTMP: 2.51*10−5; +EV +FA vs +EV +5-methyl THF p-values: AMP: 0.007, ADP: 0.006, ATP: 5.26*10−5, GMP: 0.0004, GDP: 0.006, GTP: 2.94*10−5, GAR: 0.002, AICAR: 0.003, IMP: 0.008, dTMP: 0.005). Data are normalized to protein concentration and to an internal standard. Mean +/− SEM error bars are displayed. (E) Proliferation rates of T.T MTR knockout cells +EV or +MTR cultured as in A-D in the indicated folate with or without the addition of 100 μM each of the indicated nucleotide precursors hypoxanthine (H), uridine (U), and thymidine (T) (n = 3 independent samples; except +MTR +H,U,T n = 6). (F) Proliferation rates of A549 MTR knockout cells +EV or +MTR passaged in the indicated folate with the addition of nucleotide precursors for up to 16 days (n = 3 independent samples). (G) Proliferation rates of T.T MTR knockout cells +EV or +MTR cultured in the indicated folate as in A-D, with or without 1 mM serine or formate (n = 3 independent samples). (E-G) Mean +/− SD error bars are displayed. p-values are derived from a two-tailed, unpaired Welch’s t test (* = p < 0.05, ** = p < 0.01, *** = p < 0.001).
