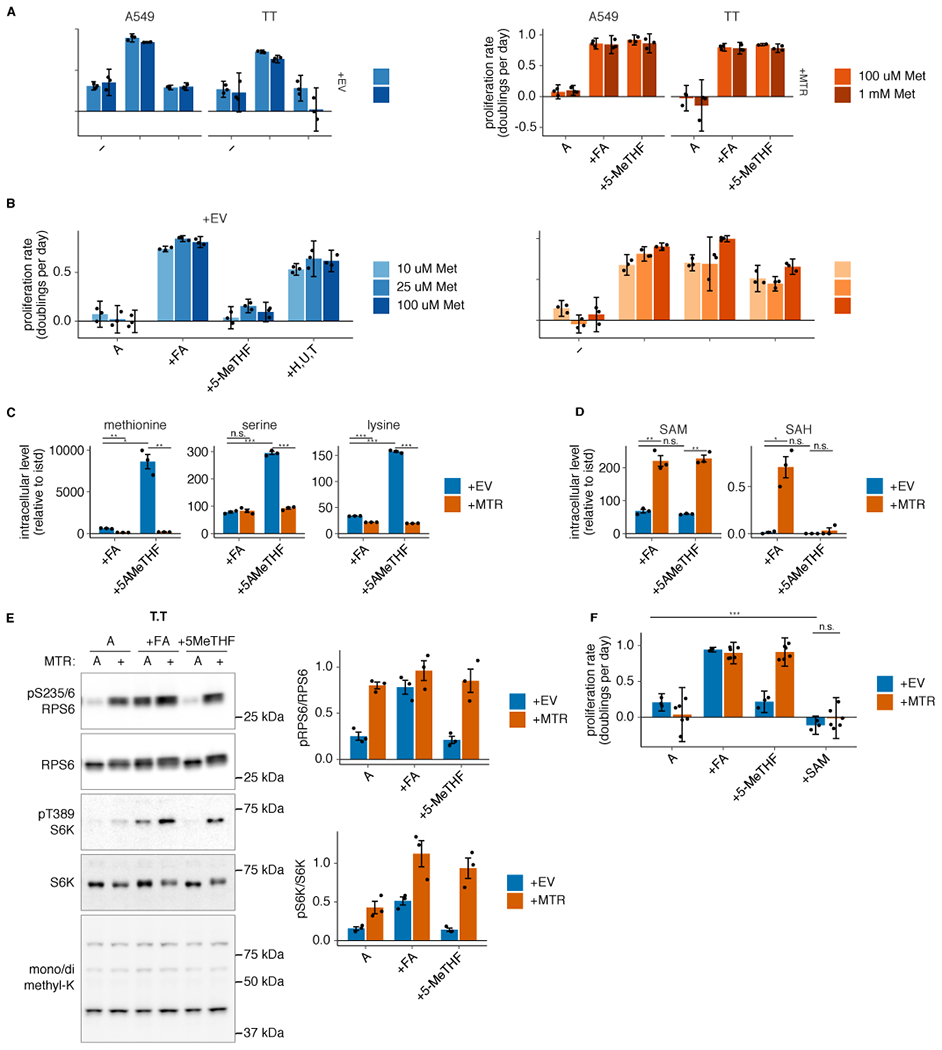
Extended Data Fig. 4. Neither SAM nor methionine levels are limiting for proliferation in MTR knockout cells in 5-methyl THF.

(A-B) Proliferation rates of A549 and T.T MTR knockout cells without (+EV) or with MTR expression (+MTR) cultured in folic acid (+FA), 5-methyl THF (5-MeTHF), or no folate (−) for 4 days after a prestarvation period, with or without 900 uM added methionine (A) or T.T MTR knockout cells +EV or +MTR cultured in the indicated folate or 100 uM each nucleotide precursor (hypoxanthine, uridine, and thymidine) at varied extracellular methionine concentrations (B). (C-D) LC/MS measurement of intracellular methionine, serine, lysine (C), SAM, and SAH levels (D) in T.T MTR knockout cells +EV or +MTR cultured in the indicated folate source as in A (n = 3 independent samples; +EV +FA vs +MTR +FA p-values: methionine: 0.002, serine: 0.57, lysine: 9.94*10−6, SAM: 0.007, SAH: 0.024; +EV +5-methyl THF vs +MTR +5-methyl THF p-values: methionine: 0.01, serine: 2.71*10−5, lysine: 0.0001, SAM: 0.003, SAH: 0.47; +EV +FA vs +EV +5-methyl THF p-values: methionine: 0.011, serine: 5.57*10−5, lysine: 0.0001, SAM: 0.24, SAH: 0.27). Data are normalized to protein concentration and an internal standard. (E) Western blots to assess phosphorylation of mTORC1 targets and levels of mono- or dimethyl lysine-containing proteins in T.T MTR knockout cells +EV or +MTR cultured in the indicated folate as in A. The ratio of phospho-protein to total protein signal from 3 independent replicates is shown. (F) Proliferation rates of T.T MTR knockout cells +EV or +MTR cultured in the indicated folate for 16 hours, with or without the addition of 1 mM SAM (n = 3 independent samples for +EV, n = 6 for +MTR; +EV −folate vs +EV +SAM p = 1.6*10−6, +EV +SAM vs +MTR +SAM p = 0.11). (A,B,F) Mean +/− SD error bars are displayed. (C-E) Mean +/− SEM error bars are displayed. p-values are derived from a two-tailed, unpaired Welch’s t test (* = p < 0.05, ** = p < 0.01, *** = p < 0.001).
