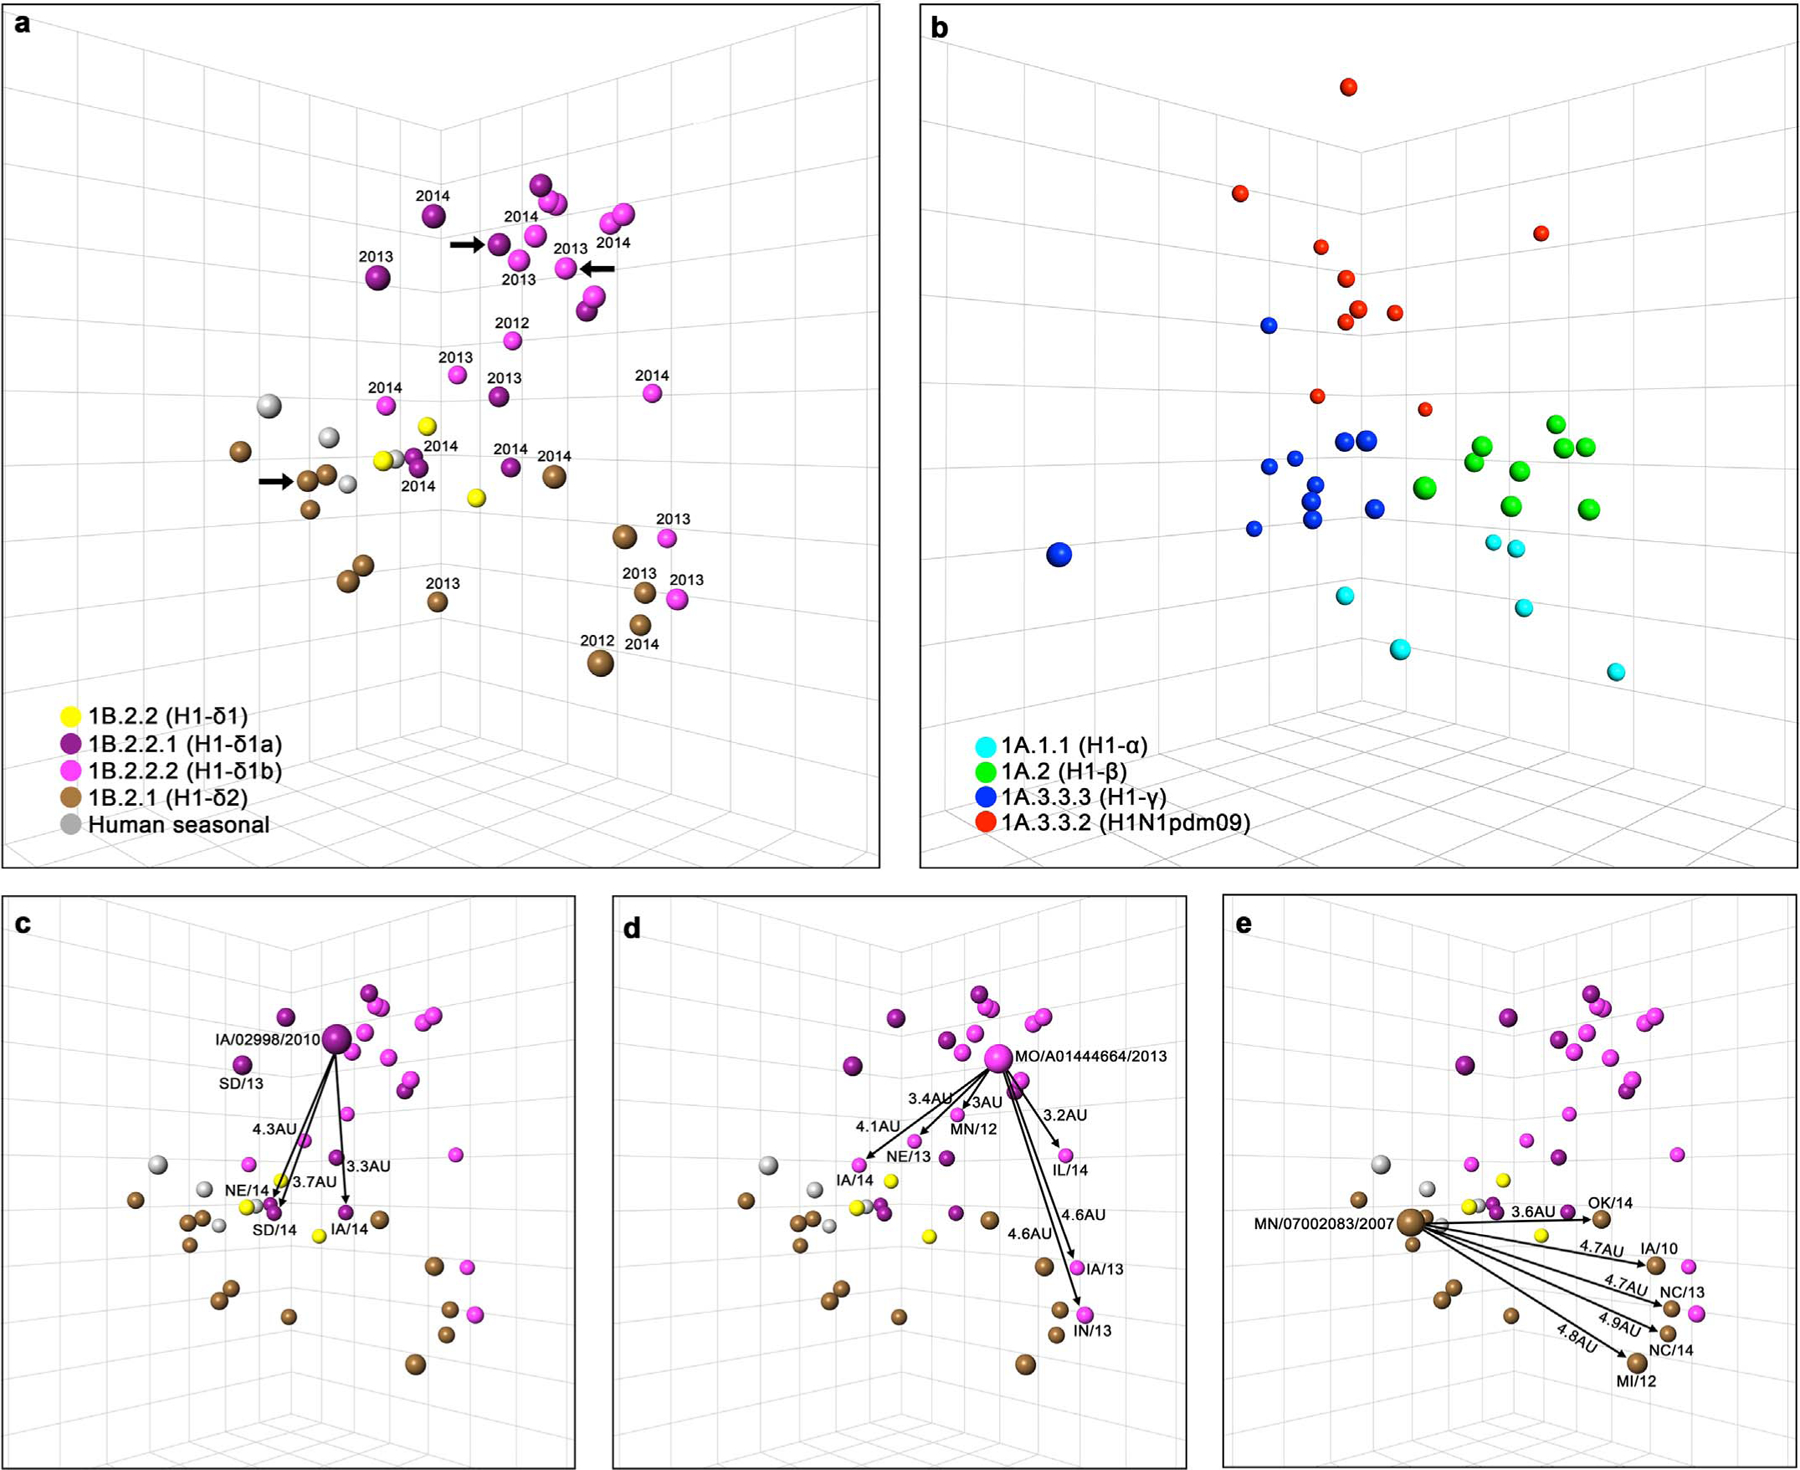
Fig. 2.

3D antigenic maps of representative historical and contemporary swine H1 influenza viruses of the 1B.2 delta (a) and 1A classical (b) lineages. Antigenic distances of outliers in comparison to antigenic cluster representative strain demonstrated for 1B.2.2.1 H1-δ1a (c), 1B2.2.2 H1-δ1b (d), and 1B.2.1 H1-δ2 (e). Isolates are shown as spheres colored by genetic clades. Each grid square represents 1 antigenic unit, corresponding to a twofold difference in HI assay titer. Year of detection is shown for contemporary delta lineage strains detected after 2012. Large arrows (a) or bigger spheres (c–e) indicate antigenic cluster representative strains A/swine/Iowa/02998/2010 (H1-δ1a), A/swine/Missouri/A01444664/2013 (H1-δ1b), A/swine/Minnesota/07002083/2007 (H1-δ2). Arrows demonstrate antigenic distance from the representative strain (c-e). Outlier strains are H1-δ1a: A/swine/Nebraska/A01492366/2014 (NE/14), A/swine/SouthDakota/A01481702/2014 (SD/14), and A/swine/Iowa/A01476931/2014 (IA/14); H1-δ1b: A/swine/Illinois/A01410405/2014 (IL/14), A/swine/Nebraska/A01290601/2013 (NE/13), A/swine/Iowa/A01410774/2014 (IA/14), A/swine/Iowa/A01432370/2013 (IA/13), A/swine/Indiana/A01260356/2013 (IN/13), and A/swine/Minnesota/A01301731/2012 (MN/12); H1-δ2: A/swine/Oklahoma/A01409770/2014 (OK/14), A/swine/Iowa/02955/2010 (IA/10), A/swine/North Carolina/A01290598/2013 (NC/13), A/swine/Michigan/A01259001/2012 (MI/12), and A/swine/North Carolina/A01475606/2014 (NC/14).
