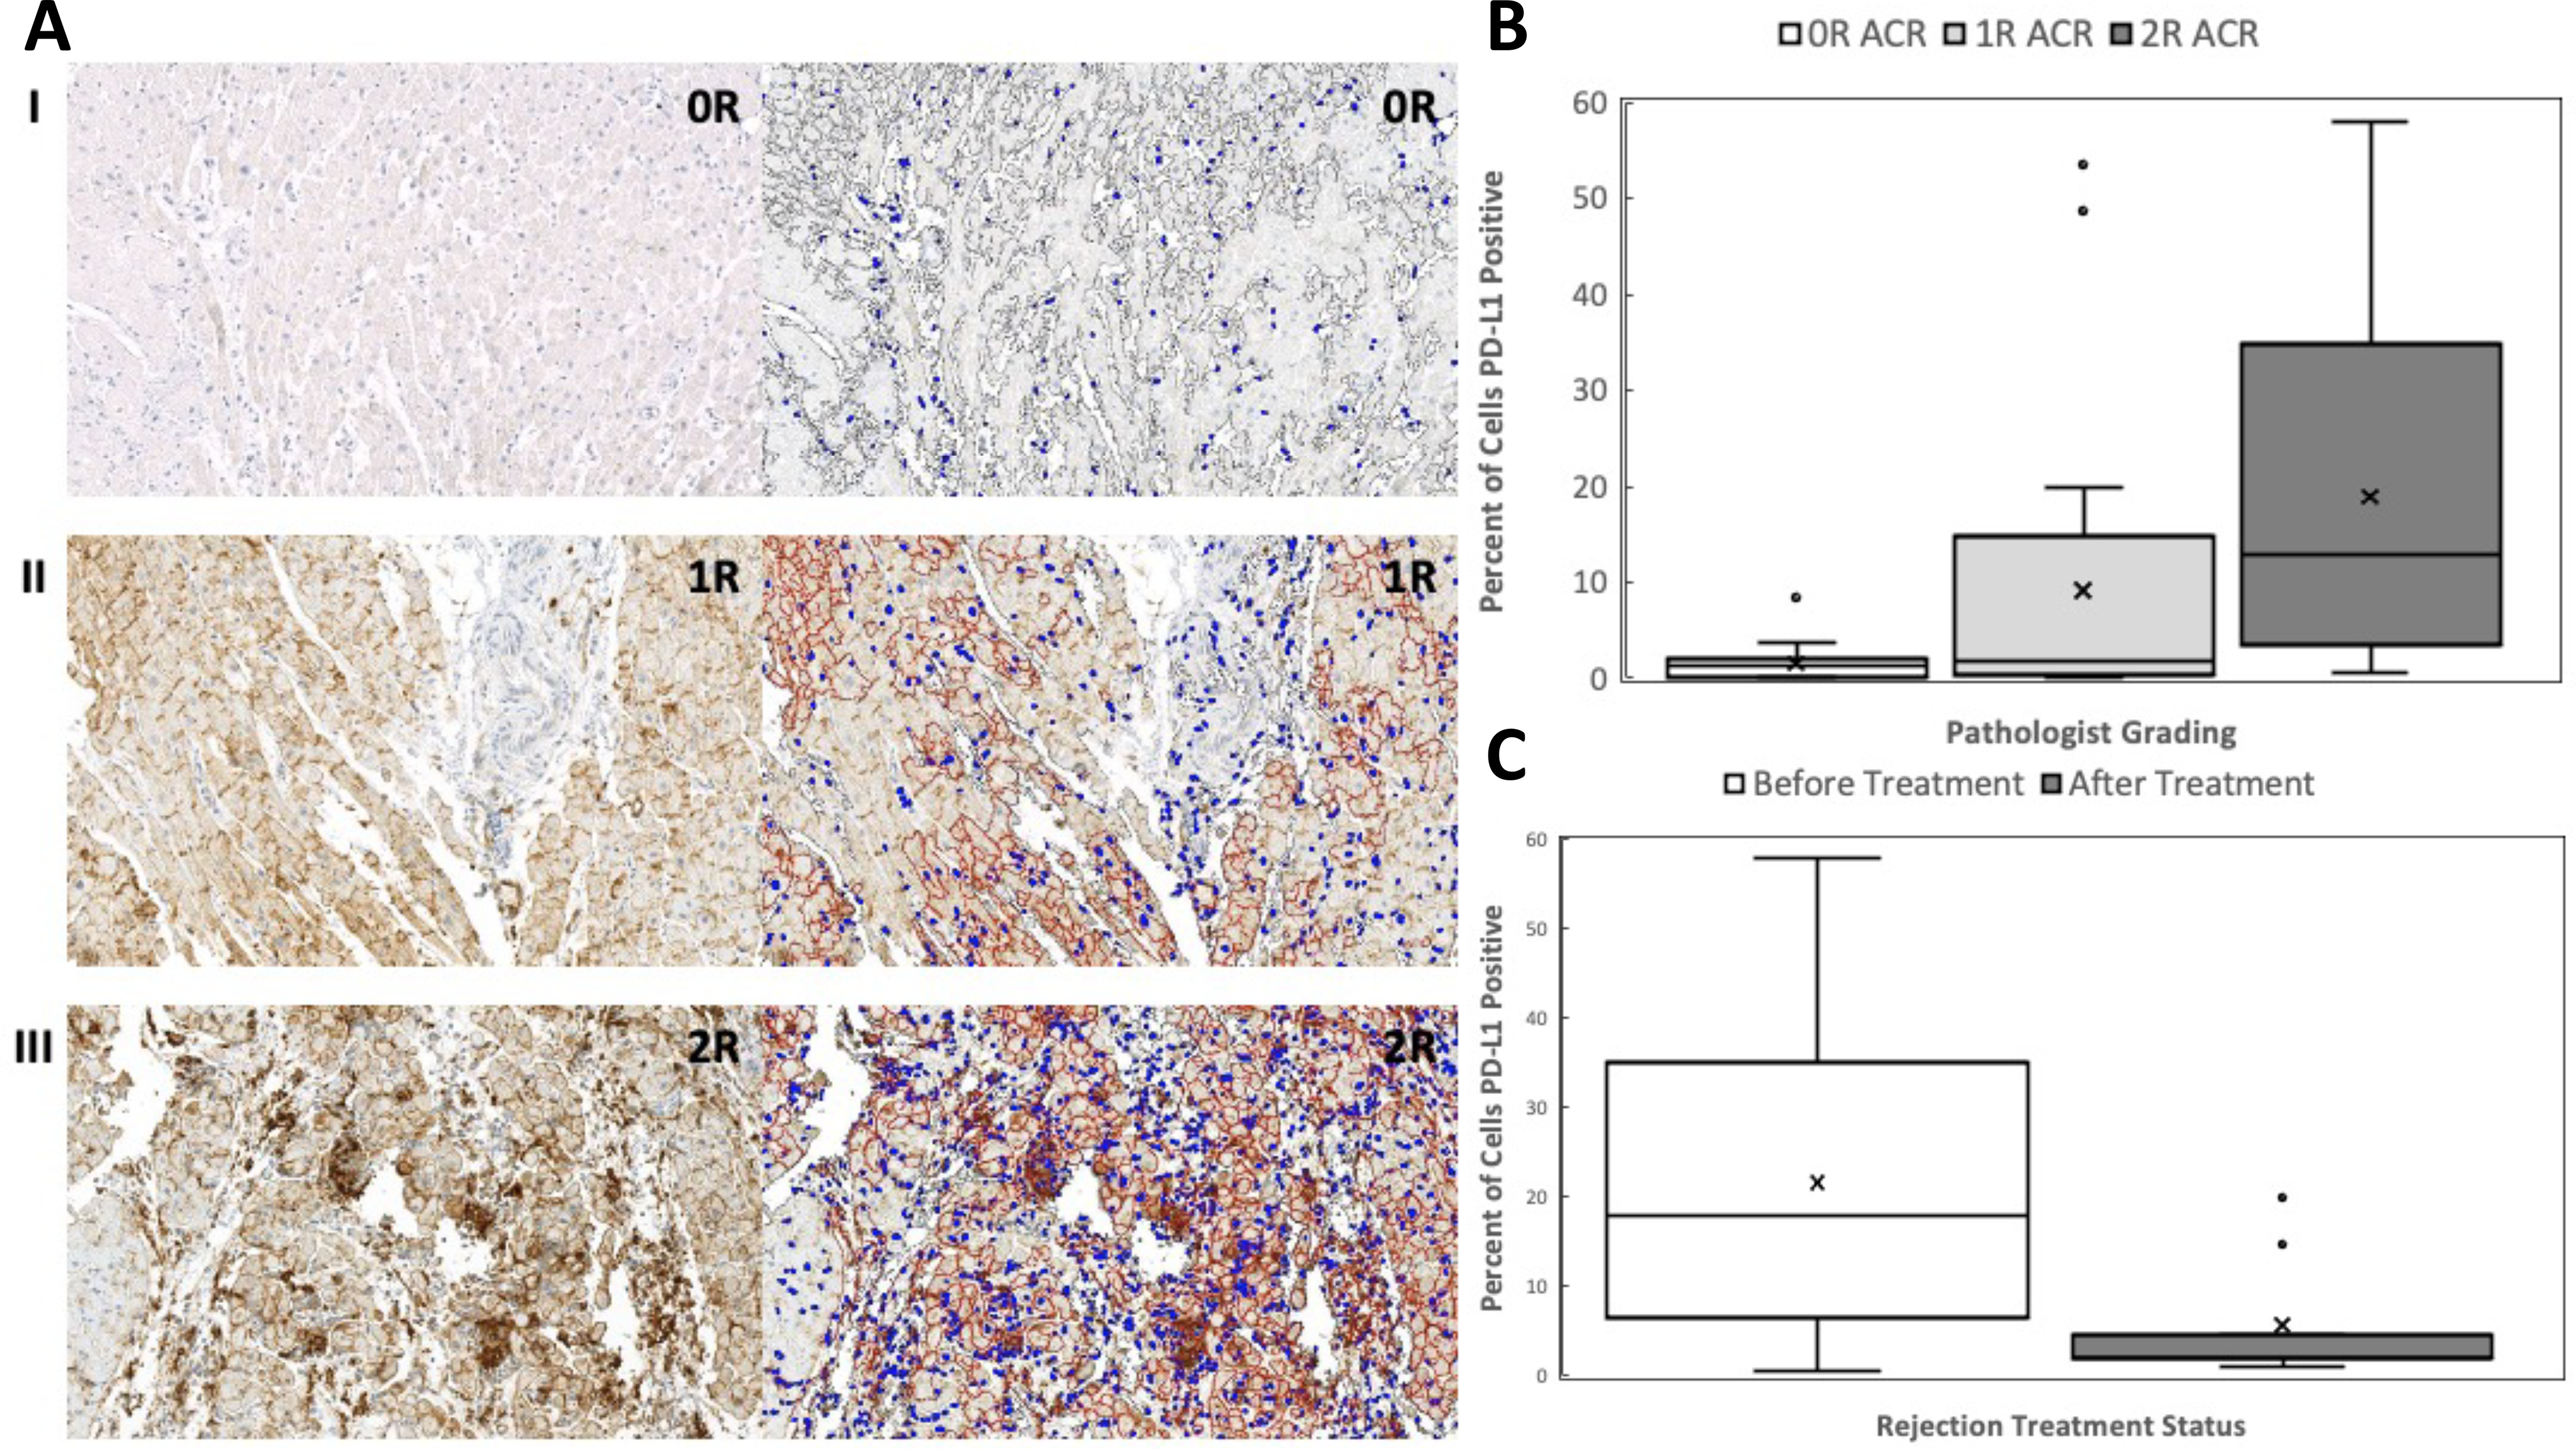
Figure 1.

Percent of cells expressing PD-L1. (A) Representative images of PD-L1 expression for patient 5. Images on left represent original staining after PD-L1 immunohistochemistry. Images on right represent alterations after manual annotation and software markup looking for PD-L1 positive cells. Brown is considered positive signal for PD-L1 expression. Blue depicts nuclei. (I) 10X magnification, 0R ACR, percent positive cells = 0.1. (II) 10X magnification, 1R ACR, percent positive cells = 15.42. (III) 10X magnification, 2R ACR, percent positive cells = 34.81. (B) Percent of cells expressing PD-L1 significantly differs between 0R and 2R rejection (P < 0.0001) as well as 1R and 2R rejection (P = 0.015) but not 0R and 1R rejection (P = 0.091). (C) Percent of cell expressing PD-L1 significantly decreases after treatment of ACR (paired Wilcoxon, P = 0.039).
