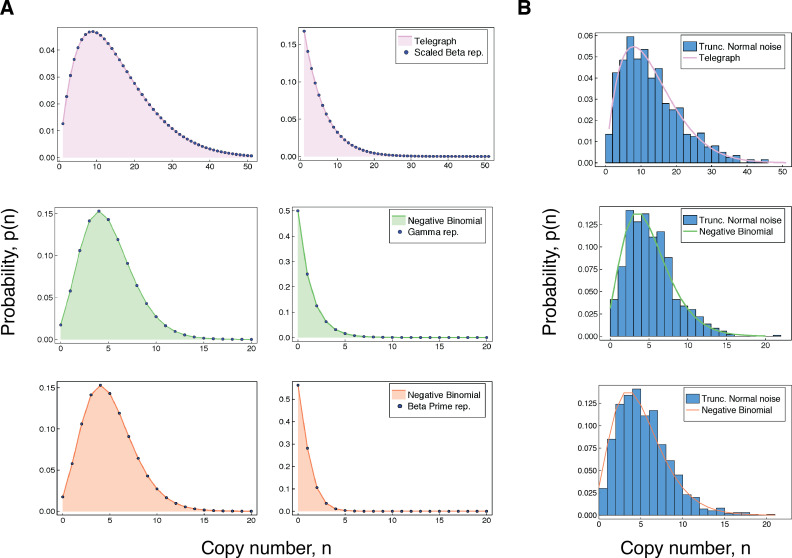
Figure 2. Accuracy of our integral representations for the Telegraph and negative binomial distribution.
(A) For each of the results in (3 - 5), we compare the (fixed-parameter) Telegraph and negative binomial distributions with their respective compound representations for two different sets of parameter values. The top panel (pink) shows comparisons for (3), with parameter values (left) , , , , and , and (right) , , , and . The middle panel (green) gives comparisons for (4), with parameter values (left) , , and and (right) , , and . The bottom panel (coral) gives comparisons for (5). The parameter values (left) are , and and (right) are , and . (B) The top figure compares a distribution with samples from a compound Telegraph distribution with normal noise on the transcription rate parameter. The middle figure compares a with samples from a compound Telegraph distribution with normal noise on the transcription rate parameter. The bottom figure compares a distribution with samples from a compound negative binomial distribution with normal noise on the burst intensity parameter.

