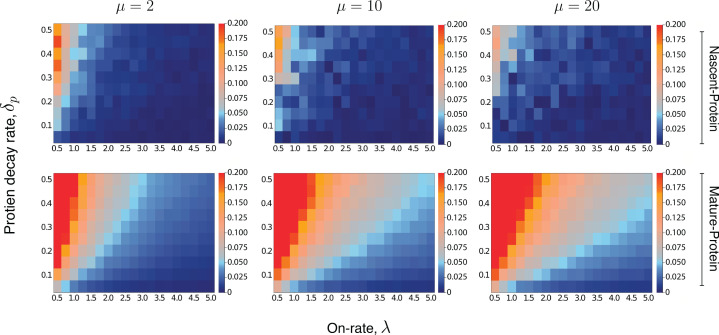
Figure 5. Heatmaps for the intrinsic contribution to the covariance.
These heatmaps estimate the level of overshoot in the pathway-reporter approach for the nascent-protein and mature-protein reporters; blue regions show an overshoot of less than .
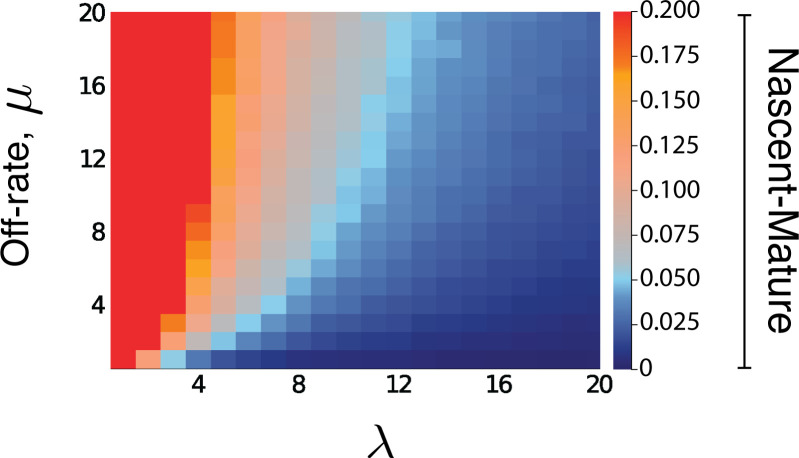
Here, the intrinsic contribution is calculated using stochastic simulations of the model . For the mature-protein and nascent-protein reporters, we consider three different values of the parameter μ, specifically , , and . In all cases, the parameter and the on-rate λ are varied between 0.01 and 0.5, and 0.5 and 5, respectively. The parameters of the model are scaled so that . The maturation rate is fixed at 20, with the parameters and chosen to produce a mean protein level of 1000, a mean nascent mRNA level of 5 and a mean mature mRNA level of 50. Each individual pixel is generated from a sample of size 3000, although there is still some instability in the convergence for the nascent-protein reporter, particularly as the overshoot estimation starts to increase, and particularly as μ is larger. To produce more accurate values, the case of was averaged over two full experiments while was averaged over three. This was also done for the mature-protein reporter, however for these images there was almost no visible difference between the various runs of the experiment and their averages. Each of the three μ values takes approximately 7–10 hr of computation, depending on lead in time before sampling within a simulation. Figure 5—figure supplement 1 gives a heatmap for the overshoot in the pathway-reporter approach for nascent-mature pathway reporters.


