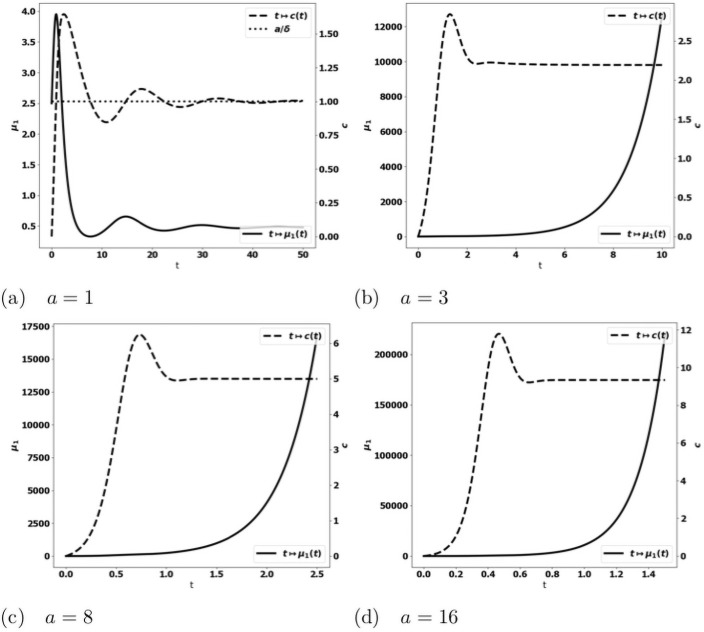
Fig 3. Typical behavior of the solutions of the simplified ODE system (13).
Data: V = 0.616, δ = 1., S = 1.5, kr = 1.25, kc = 0.1, m = 2. x-axis: time, y-axis: μ1, mass of the tumor (plain, left axis), and c, strength of the active immune cells (dashed, right axis); the expected equilibrium value is a/δ (dotted line in fig. (a)). When a is small enough, the tumor is controlled and the concentration of immune cells tends to the equilibrium value (fig. (a)). For larger a, the concentration of immune cells tends to a constant smaller than the expected equilibrium and the tumor mass blows up (fig. (b)-(d)). Mind that the time scale differs: in (b)-(d) the tumor mass mass blows rapidly, the larger a, the faster the blow up.

