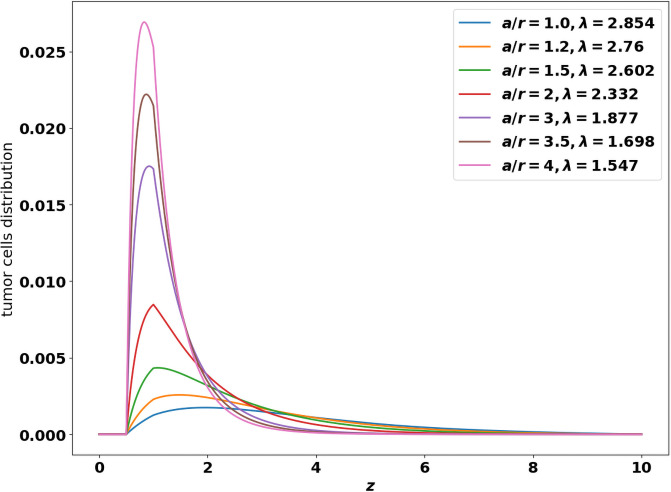
Fig 5. Shapes of the leading eigen-function, solution of the growth-division Eq (21).
x-axis: z, size of the tumor cells, y-axis: number of tumor cells at the final time. The profiles are obtained for the binary cell division operator (3) with a constant division rate a > 0. and the Gompertz law (1) for the growth rate. The shape is driven by the ratio where r = (1 + β∞) is the intrinsic growth rate of the tumor cells.

