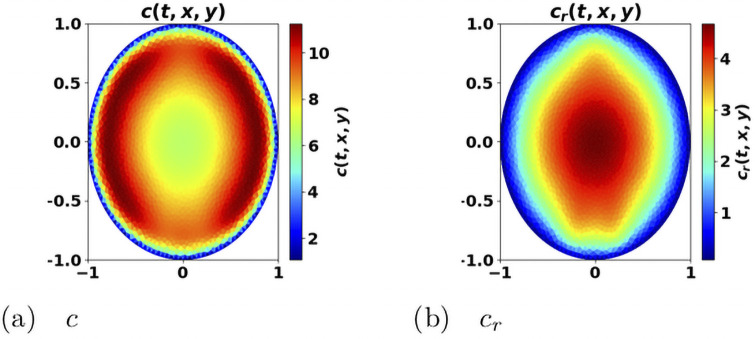
Fig 7. Space distribution of immune cells.
Antitumor cells c (left) and protumor cells cr (right). x-y axis: space coordinates. The concentration of protumor cells is higher in the vicinity of the tumor, where the concentration of antitumor cells has been depleted. The picture has been obtained from the simulation of the system (12a)–(12g), at final time t = 2.23, with a = 4.

