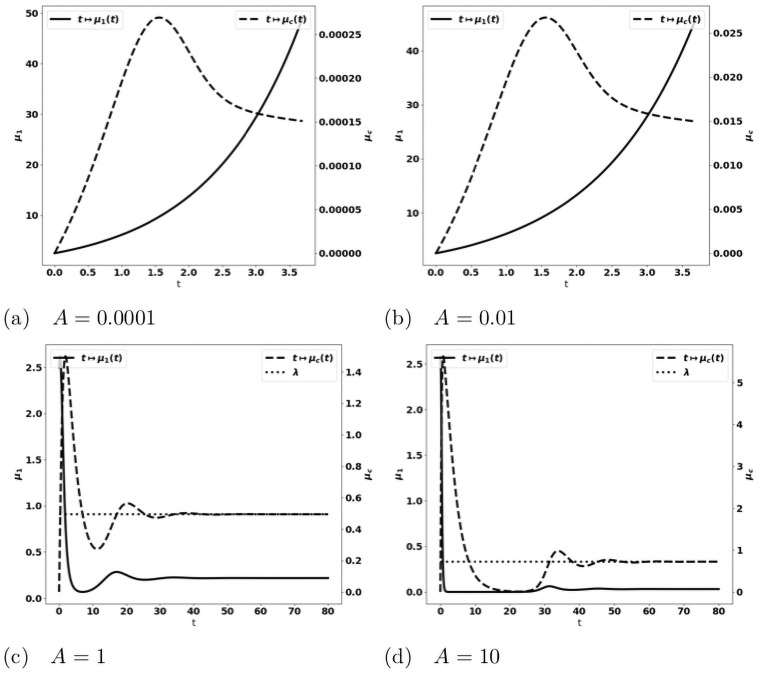
Fig 12. Simulation of the PDE model (12a)–(12g) for several values of the immune strength A.
Evolution of the tumor mass μ1 (plain, left axis), and of the immune strength (defined in (26), dashed, right axis); expected equilibrium value λ (dotted line in fig. (c) and (d)). When A is large enough an equilibrium is reached with tending to the eigenvalue λ of the cell-division equation, and a residual tumor mass (fig. (c) and (d)). For smaller A’s the tumor escapes the control of the immune system and its mass bows up (fig. (a) and (b)).

