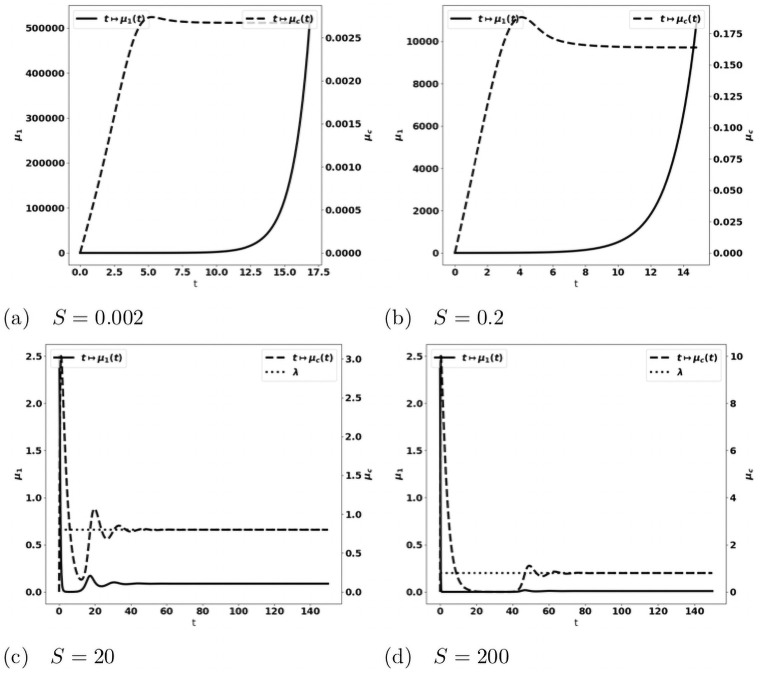
Fig 15. Validation of the PDE model (b1 = 0, V and a constant).
Evolution of the tumor mass μ1 (plain, left axis), and of the immune strength (dashed, right axis) for several values of the source of immune strength A expected equilibrium value λ (dotted line in fig. (c) and (d)). When A is large enough an equilibrium is reached with tending to the eigenvalue λ of the cell-division equation, and a residual tumor mass (fig. (c) and (d)). For smaller A’s the tumor escapes the control of the immune system and its mass bows up (fig. (a) and (b)).

