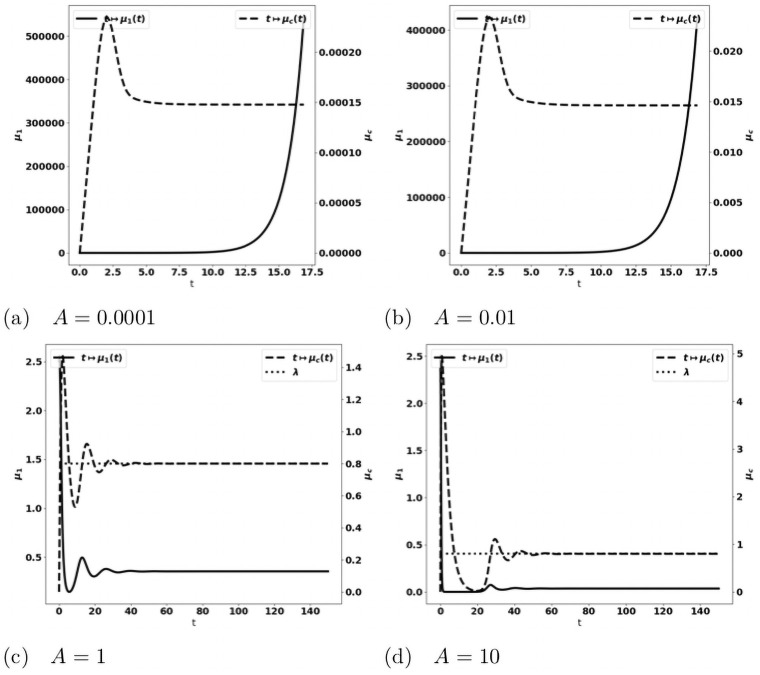
Fig 16. Validation of the PDE model (b1 = 0, V and a constant).
Evolution of the averaged protumor cells concentration (square, left axis), and of the immune strength (dashed, right axis) for several values of the division rate a. For small a (fig. (a)), the concentration of antitumor immune cells reaches the equilibrium, and the concentration of protumor cells is damped; for large a (fig. (b)), the equilibrium does not establish and the concentration of protumor immune cells keeps growing.

