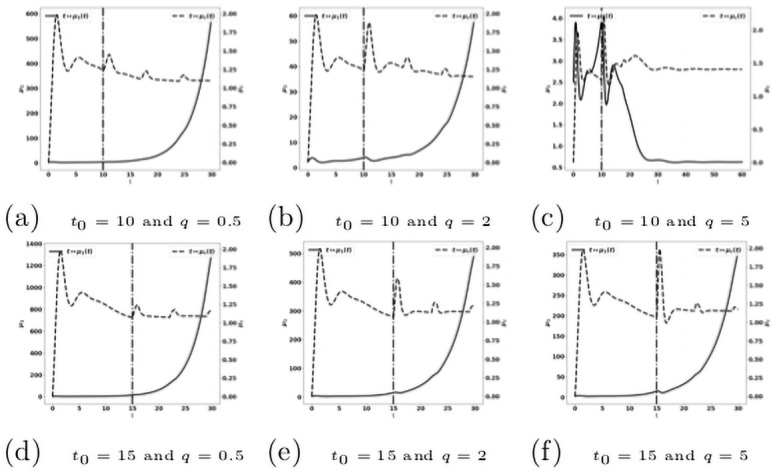
Fig 19. Reactivation of exhausted antitumor cells: Late administration of the treatment.

Simulation performed on the system (28a)–(28g), with (29)–(31). Evolution of the tumor mass μ1 (plain, left axis), and of (dashed, right axis) for several values of the treatment dose q. The dash-dotted line represents the time at which the treatment starts.
