Figure 10.

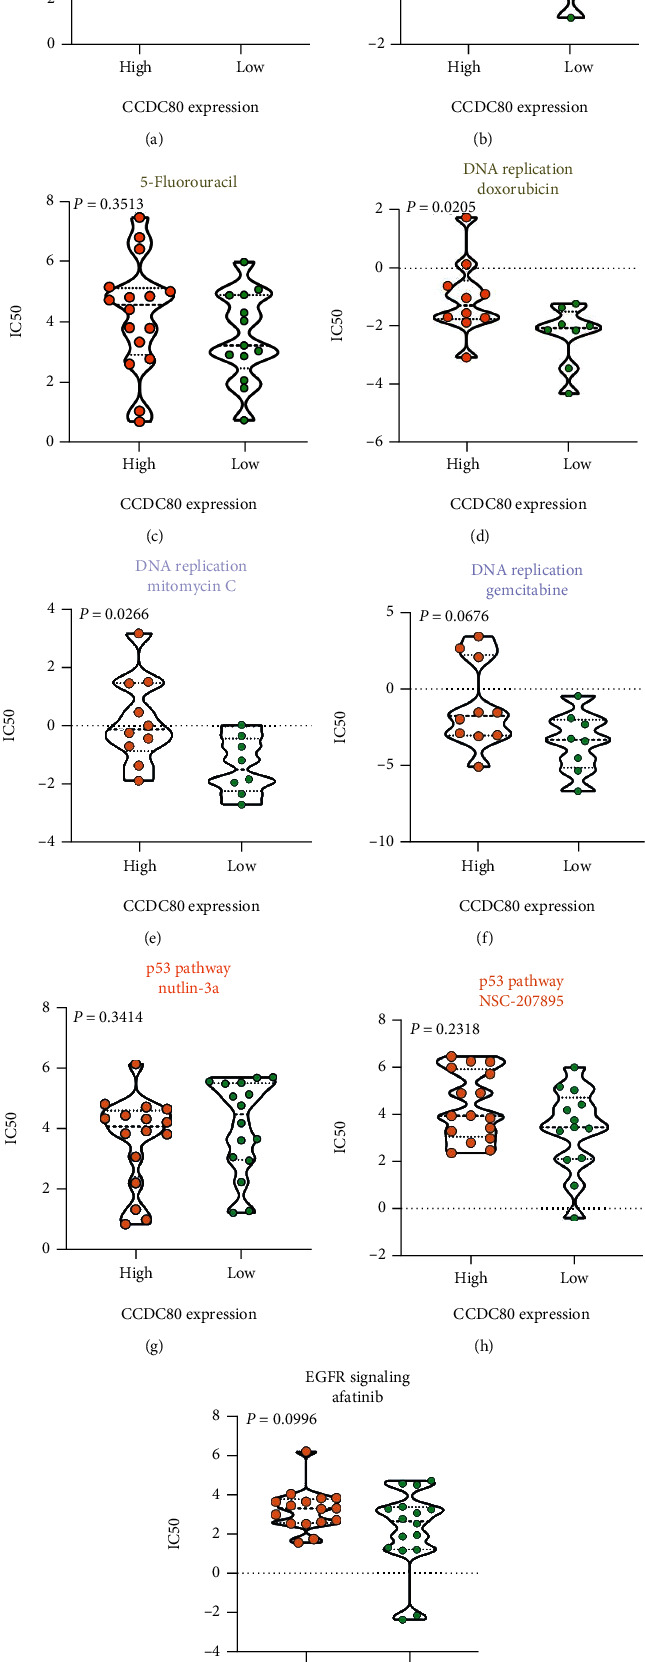
Violin plots visualizing the differences of estimated half maximal inhibitory concentration (IC50) of compounds between high- and low-CCDC80 expression group.

Violin plots visualizing the differences of estimated half maximal inhibitory concentration (IC50) of compounds between high- and low-CCDC80 expression group.