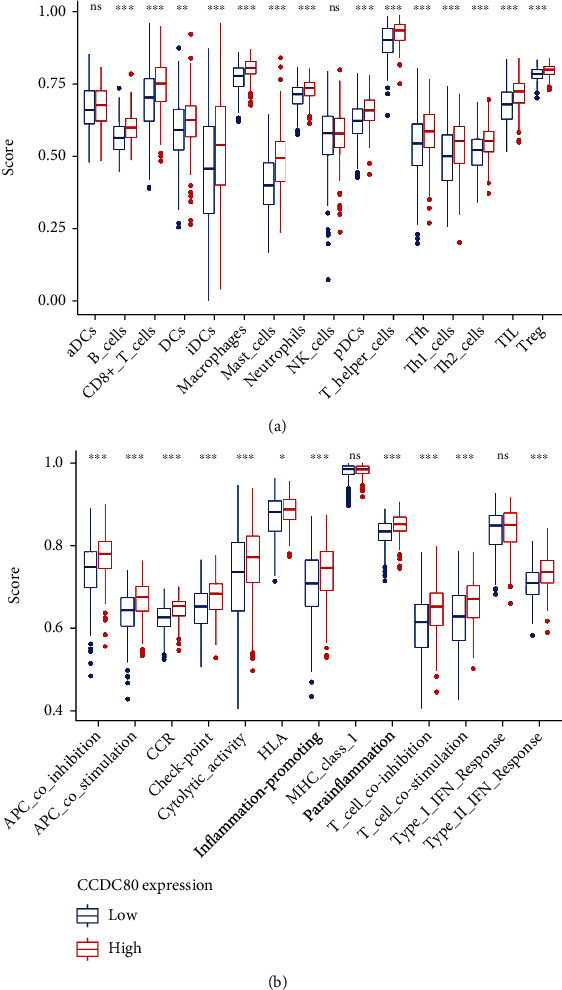
Figure 6.

The boxplots visualizing the single-sample gene set enrichment analysis (ssGSEA) in high- and low-CCDC80 expression group in OVCA based on immunocyte-related gene sets (a) and immune function-related gene sets (b) (∗∗∗, P < 0.0001; ∗∗, P < 0.001; ∗, P < 0.05; ns, P ≥ 0.05).
