Figure 7.

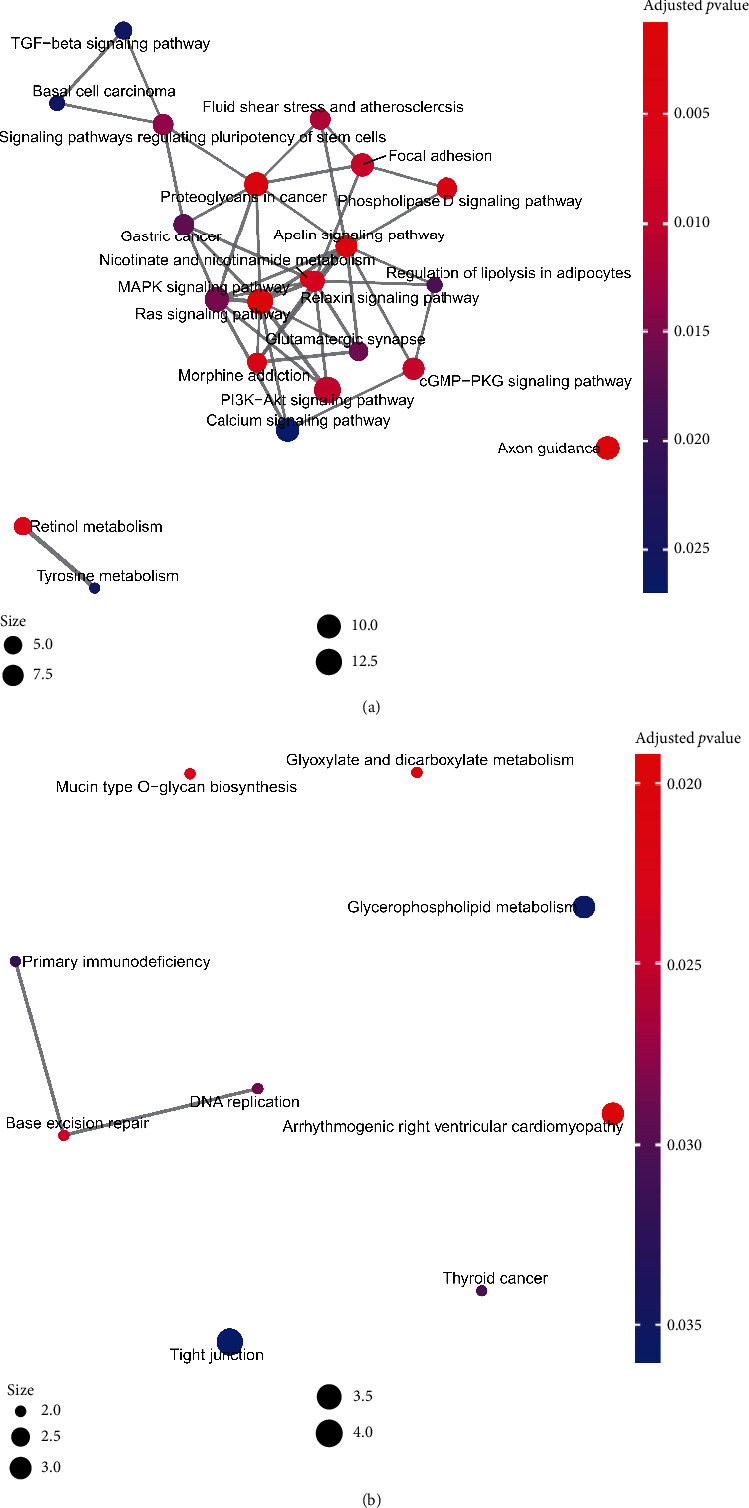
KEGG enrichment plots of the intersection genes from CCDC80 positively related coexpressed genes (CEGs) and downregulated differentially expressed genes (DEGs) (a), and CCDC80 negatively related CEGs and upregulated DEGs (b).

KEGG enrichment plots of the intersection genes from CCDC80 positively related coexpressed genes (CEGs) and downregulated differentially expressed genes (DEGs) (a), and CCDC80 negatively related CEGs and upregulated DEGs (b).