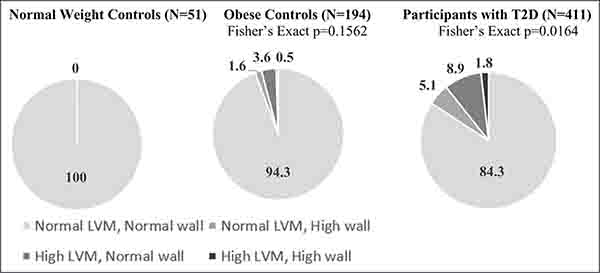
Figure 2. Distribution of left ventricular (LV) geometry at 5-y follow-up in participants and normal-weight and obese controls.
Each cohort was stratified into 4 groups according to LV mass (cutoff at 51 g/m2.7) and relative wall thickness (cutoff at 0.42): normal, LV hypertrophy (increased LV mass only), concentric geometry (increased relative wall thickness only), and LV hypertrophy with concentric geometry. Data are percentage. LVM indicates left ventricular mass; and T2D, type 2 diabetes mellitus.

