
FIGURE 7.
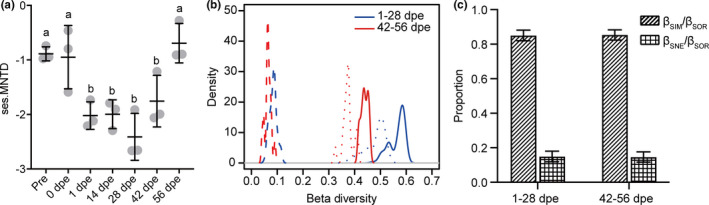
Analysis of the ecological processes of the bacterial community at different A. japonicus gut regeneration stages. (a) Changes in ses.MNTD over the gut regeneration period. Different lowercase letters above the error bars indicate significant differences among groups. (b) The partitioning of βSOR (solid line) into βSIM (dotted line) and βSNE (dashed line). (c) The proportions of βSIM and βSNE in βSOR. Lowercase letters above the error bars indicate significant differences in βSIM/βSOR among groups and capital letters indicate significant differences in βSNE/βSOR among groups